Sponsored By:
![]()
Today’s Summary
Thursday, April 1st, 2021
Indices: US stocks ended the week on a positive note with the Dow Jones Industrial Average advancing 172 points or 0.52%. The S&P 500 and Nasdaq rose 1.18% and 1.76%, respectively. The Russell 2000 gained 1.50%.
Sectors: 8 of the 11 sectors closed higher. Energy led, gaining 2.55%. Consumer Staples lagged, falling 0.48%.
Commodities: Crude Oil futures moved higher by 3.87% to $61.45 per barrel. Gold futures rose 0.75% to $1,728 per ounce.
Currencies: The US Dollar Index fell 0.38%.
Interest Rates: The 10-year US Treasury yield dropped to 1.672%.
Here are the best charts, articles, and ideas being shared on the web today!
Chart of the Day
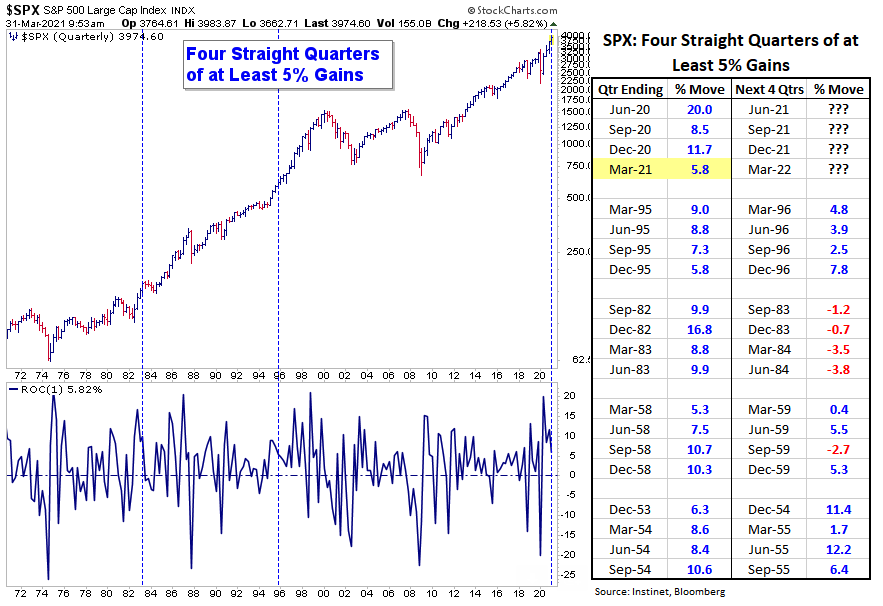
Today’s Chart of the Day was shared in a note by Frank Cappelleri of Instinet (@FrankCappelleri). It’s a quarterly bar chart of the S&P 500 over the past five decades. Frank points out that the S&P 500 just logged its fourth straight quarterly gain of at least 5%. The last time that happened was in 1995, in the early innings of a 14 quarter winning streak. Imagine that! That’s 10 more quarters (2.5 years) of perpetual quarterly gains after an already impressive run. To be fair, it also happened in 1983 and was followed by a mild four-quarter losing streak. But of all the four prior instances since 1950, the market was higher one year later more often than not.
Sponsored:

![]()
Quote of the Day
“Don’t believe everything you read on the internet.”
– John Maynard Keynes
Top Links
Historically April is One of the ‘Best Performing’ Months For The Stock Market – Yahoo Finance
Several analysts point out that April has historically been one of the best strongest months for stocks.
Monthly Candlesticks – March 2021 – Alf Charts
Alfonso Depablos highlights some notable monthly candlestick charts.
Sentiment Goes the Other Way of Price – Bespoke
Bespoke breaks down the results of the latest AAII Sentiment Survey.
Checking In On GDX – All Star Charts
The team at All Star Charts takes a look at Gold Mining Stocks.
What Happens After Bubbles Pop? – Osprey
Here’s a great read from Dr. Phil Perleman on speculative bubbles.
Top Tweets
S&P 500 Index tops 4,000 for the first time ever! pic.twitter.com/ra39jxzJzW
— jeroen blokland (@jsblokland) April 1, 2021
$SPY #SPY Solid weekly close with strong seasonality into April! pic.twitter.com/hTCFLQKa7d
— TrendSpider (@TrendSpider) April 1, 2021
“April is by far the best performing month for the SPX over the last 15 years.” In fact, it “hasn’t had a down April since 2012. This bodes well for our thinking of an April Blowoff towards 4,100, but we .. wouldn’t be surprised if early month gains are given back..” @jkrinskypga pic.twitter.com/NgvQKBa38h
— Carl Quintanilla (@carlquintanilla) April 1, 2021
The S&P 500 Index has averaged a gain of 2.5% in April over the past two decades with 80% of periods showing positive results. https://t.co/XEWuDg8taE $SPX $SPY $ES_F $STUDY #Seasonality pic.twitter.com/CpEWWQXGDO
— Equity Clock (@EquityClock) March 31, 2021
$NDX Q1 Doji Candles …. pic.twitter.com/W3aVDXul0M
— Nautilus Research (@NautilusCap) April 1, 2021
Lots of indecision to start 2021 for $NDX. Looks a little similar to trend we saw leading up to the 2016 election. pic.twitter.com/IlPT43Gyxw
— Ian McMillan, CMT (@the_chart_life) April 1, 2021
$GDX nice close for the week. Looks constructive. Let's see if it can get out of this downtrend. Waiting / watching pic.twitter.com/V0L5uwgMxC
— Gregory Krupinski (@G_krupins) April 1, 2021
Euro Bank / Archegos exposure not hitting Europe. pic.twitter.com/cFpH4B9p74
— Strategas (@StrategasRP) April 1, 2021
I've been waiting for this breakout in European Stocks since I was in High School…. pic.twitter.com/nofgtAqMTc
— J.C. Parets (@allstarcharts) April 1, 2021
The S&P 500 hits 4,000 on April Fool’s day as investors realize that valuations are a joke
— Dr. Parik Patel, BA, CFA, ACCA Esq. ? (@ParikPatelCFA) April 1, 2021

You’re all caught up now. Thanks for reading!