Sponsored By:

Today’s Summary
Wednesday, April 22nd, 2020
Indices: US Stocks closed higher with the Dow Jones Industrial Average advancing 557 points or 1.99%. The S&P 500 and Nasdaq closed higher by 2.29% and 2.81%, respectively. The Russell 2000 was the weakest of the major indices but still rose 1.39%.
Sectors: All 11 sectors closed higher. Technology led, gaining 3.85%. Consumer Staples lagged but still closed higher by 0.96%.
Commodities: The June Crude Oil futures contract surged 23% to $14.23 per barrel. Gold futures jumped 2.99% to $1,738 per ounce.
Currencies: The US Dollar Index rose 0.13%.
Interest Rates: The US 10-year Treasury yield moved higher to 0.619%.
Here are the best charts, articles, and ideas being shared on the web today!
Chart of the Day
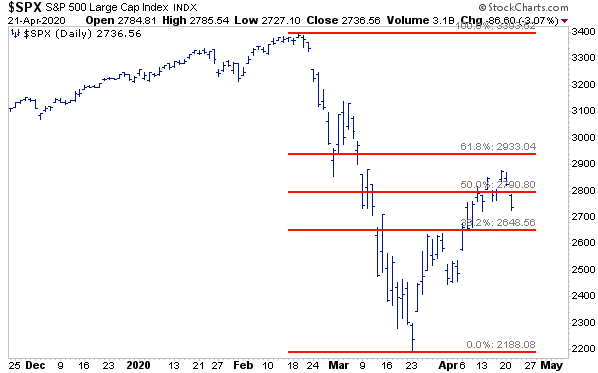
Today’s Chart of the Day was shared in a research note by Frank Cappelleri of Instinet (@FrankCappelleri). It’s a bar chart of the S&P 500 index over the past four months. In the note, Frank explains – “The SPX’s 31% rally hasn’t even tagged the 61.8% retracement level yet. From this perspective alone, any counter-trend move that peters out shy of that mark remains just that – a counter-trend move taking place within a bigger dominant (down) trend.” Technicians often use key Fibonacci retracements levels like 38.2% and 61.8% after a significant decline, in order to identify potential inflection points. According to Fibonacci analysis, this is simply a bear market rally until price proves otherwise by retracing over 61.8% of the February-March decline.
Quote of the Day
“Markets are strongest when they are broad and weakest when they narrow to a handful of blue-chip names”
– Bob Farrell (Technical Analyst)
Top Links
Gold Target $3,000 Per Oz, Due to This Pattern! – Kimble Charting Solutions
Chris Kimble explains why he thinks Gold could reach $3,000 per ounce if price continues to form a multi-year Cup & Handle pattern.
Beware of These Divergences – All Star Charts
Steve Strazza points out that market internals are deteriorating and that several bearish divergences are present.
Investors Beware As USO Contango Collapse Fuels PnL Pain – Bespoke
Retail traders looking to take advantage of the historic crash in Crude Oil have piled into the popular Oil ETF, $USO. In this note, Bespoke warns of some of the potential problems with using this ETF as a vehicle to buy Crude Oil.
The Economic Modern Family Tells a Story – StockCharts.com
Michele Schneider gives an update on a group of popular ETF’s she dubs the ‘Economic Modern Family’ – $IWM, $SMH, $IYT, $XRT, $KRE, and $IBB.
Stocks Rally as Oil Recovers After Hitting 21-Year Lows – Yahoo Finance
In this clip, Ari Wald of Oppenheimer weighs-in on the recent action in the energy space and the broader market.
Top 10 Tweets
The S&P 500 just had one of the best 20-day rallies in history.
The previous 10 largest 20-day gains saw the S&P 500 higher a year later 10 out of 10 times and up +20.9% on average. pic.twitter.com/NJmHFWGatN
— Ryan Detrick, CMT (@RyanDetrick) April 22, 2020
$SPX gains 2% or more and:
Equal Weight lags
Banks lag
Small caps lagOnly dates that match:
4/22/2020
4/14/2020
3/30/2020
3/4/2020
12/26/2018
11/7/2018
8/26/2015
12/18/2014
11/7/2008
10/20/2008
10/13/2008— Steve Deppe, CMT (@SJD10304) April 22, 2020
S & P E-Mini Futures $ES_F $SPX $SPY pic.twitter.com/3hulNp8zh0
— Bhagyashree (@sunsofttech) April 22, 2020
Optext Breadth is suggesting there is limited support for current move up with only 30% of $spx stocks being in an Optex uptrend. We need to see that get above 45% to have confidence in the recovery. Optex explanation below. pic.twitter.com/jiqX2yigVW
— Mathew Verdouw, CMT, CFTe (@mathewverdouw) April 22, 2020
$XLF / $SPY has busted November 2011 bottom and is testing March 2009. Not healthy. pic.twitter.com/2Qwys2qJrX
— Mark Ungewitter (@mark_ungewitter) April 22, 2020
This might be the most important chart for me right now (though weekly chart of $XVG is key as well):
want to see sustained increases in copper and bond yields to believe that prices gains in $SPX have staying power. pic.twitter.com/LDQhIEVBzw— Willie Delwiche (@WillieDelwiche) April 22, 2020
$EEM & Copper have stuck together through all this craziness pic.twitter.com/pdwW9btRZW
— Lighthouse Capital (@LighthouseCap23) April 22, 2020
$HG_F >>
on the technical side: another chart to keep an eye on is Dr. #copper..wedge break and nearing a retest (and watch for reject)
on the fundamental side: if China goes on lock down again…forget it ..its done pic.twitter.com/22q5pVaSQZ— ??? ?️ (@chigrl) April 22, 2020
Even if you were the smartest Oil macroeconomist in the world, you could've just identified that $USO was in a decade long downtrend and just moved to another potential opportunity. pic.twitter.com/z1BoYxgyGz
— Louis (@haumicharts) April 22, 2020
Robinhood traders piled into the $USO ETF during oil's historic rout https://t.co/YlUdClEfVr pic.twitter.com/wiVnI3QEU8
— Joe Weisenthal (@TheStalwart) April 22, 2020