Sponsored By:

Today’s Summary
Wednesday, May 19th, 2021
Indices: US Stocks continued lower in today’s session with the Dow Jones Industrial Average falling 165 points or 0.48%. The S&P 500 slipped 0.29%, while the Nasdaq closed flat (0.03%). The Russell 2000 underperformed, dropping 0.78%.
Sectors: 2 of the 11 sectors closed higher. Tech led, rising 0.35%. Energy lagged, falling 2.49%.
Commodities: Crude Oil futures dropped 3.27% to $63.36 per barrel. Gold futures inched higher by 0.11% to $1,870 per ounce.
Currencies: The US Dollar Index rose 0.46%.
Interest Rates: The 10-year US Treasury moved higher to 1.675%.
Here are the best charts, articles, and ideas being shared on the web today!
Chart of the Day
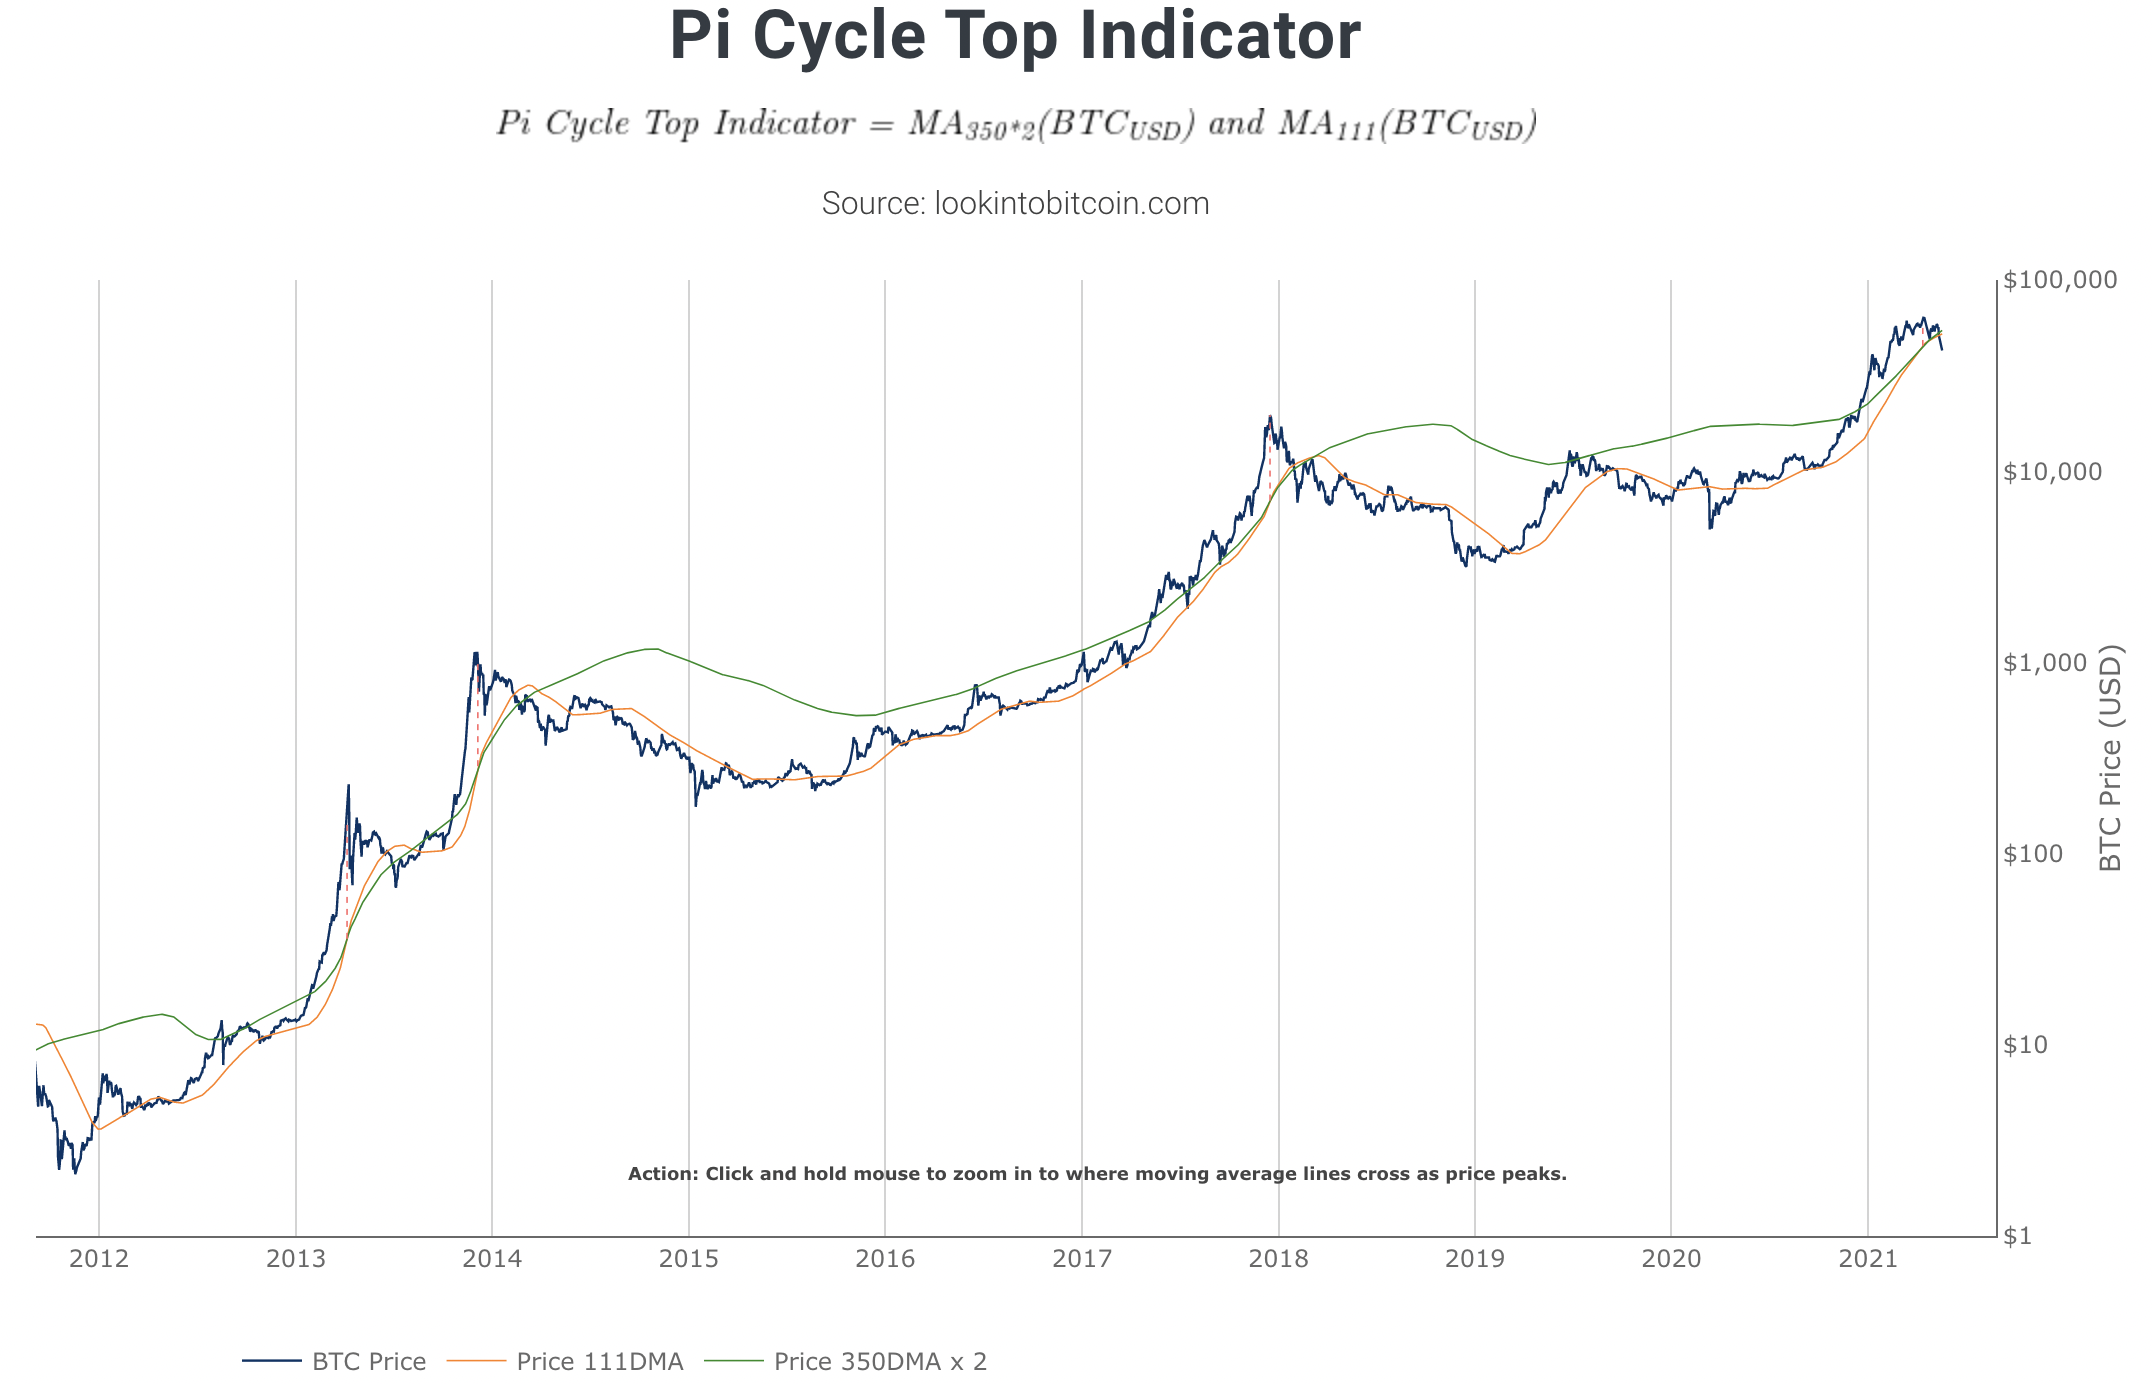
Today’s Chart of the Day comes from lookintobitcoin.com. It’s a chart of Bitcoin over the past decade along with a fascinating indicator called the Pi Cycle Top Indicator. This indicator has been very timely at identifying cycle tops over the past decade for Bitcoin. It recently flashed an ominous sell signal around $63,000 on April 13th…the day before the Coinbase IPO. The indicator is calculated using two moving averages – one simple 111-day moving average (orange) and a 2x multiple of the value of the 350-day moving average (green). For my math geeks out there reading this – the indicator is named after Pi because, 350/111 = 3.153, which is the closest you can get to Pi by dividing 350 by another whole number. Sell signals are triggered when the faster 111-day moving average crosses above the slower 2x(350-day moving average). Bitcoin is already down more than 30% from the most recent signal, so it may be difficult to act on it at this point. But, given its timely track record, the Pi Cycle Top Indicator appears to be a good tool for crypto analysts to keep in their toolbox. For more on this little-known indicator, click here.
Quote of the Day
“It is wise to remember that too much success in the stock market is in itself an excellent warning.”
– Gerald Loeb
Top Links
Less Aggressive is Still Prudent – Potomac Fund Management
Dan Russo highlights some current market themes.
The 50-day and the early Gap Tell the Tale for QQQ – StockCharts
Art Hill examines the near-term outlook for the S&P 500 and the Nasdaq 100.
Commodities About to Blow Up or Blast Off Here? – Kimble Charting Solutions
Chris Kimble points out that Commodities are at a key inflection point.
U.S. Stock Market Update: Watch The 50-Day Moving Averages! – See It Market
Mish Schneider points out that all eyes are on the 50-day moving average right now.
Is a Head & Shoulders Top Forming – Almanac Trader
Jeff Hirsch examines a potential topping pattern forming on the Nasdaq.

Want to try out Trade Ideas Premium?
Our Test Drive runs from May 10th – May 21st. Reserve your spot!
It’s time to start beating the averages! Below are just a few of the powerful tools that you’ll be using during the Test Drive.

![]()
Top Tweets
Another challenge of the 50-day Moving Average.$SPX
— Andrew Thrasher, CMT (@AndrewThrasher) May 19, 2021
$NQ, 1h
This is a text book examples of a former support acting as resistance pattern.
Price action is all you need to know. pic.twitter.com/5K7ljivu7I
— Yuriy Matso (@yuriymatso) May 19, 2021
There are a few brights spots of green amongst the sea of red. Some examples are: $TGT, $CRM, $TTWO, $ADI, $MXIM, $AMD, $LRCX, $MXIM, $XLNX, $KLAC. Many of those are in the Technology sector. Hmmm… pic.twitter.com/T74H5sno5i
— Connie Hill (@CHill_TDA) May 19, 2021
$SMH is up on the day and $SMH : $SPY RS is testing underside of former uptrend pic.twitter.com/4b8tR5Def6
— Bailey.Baxter2020 (@BBaxter2020) May 19, 2021
New trends will often ignore the overbought condition, or at worst resolve thru time. #gold there now, let's see how she does, it will speak volumes. $GLD $GDX pic.twitter.com/RG9Lw75Ldj
— RenMac: Renaissance Macro Research (@RenMacLLC) May 19, 2021
Not just Gold Miners improving, Silver Miners too. pic.twitter.com/inPr9XLlXa
— Strategas (@StrategasRP) May 19, 2021
Did you see this big base in Junior Silver Miners?$SILJ pic.twitter.com/TgSh2M1jBR
— R. Alfonso Depablos (@AlfCharts) May 19, 2021
There are some signs that we may be reaching peak inflation. For example, commodities prices, which are starting to soften (just a bit) after a torrid run higher. I am a long-term commodity bull, but to me this looks like a bull market looking for a rest. pic.twitter.com/wJDcUfTKMH
— Jurrien Timmer (@TimmerFidelity) May 19, 2021
$BTC dropping the biggest hammer the chart world's ever seen right on its 200 day sma. Go figure. pic.twitter.com/OX7PgXreup
— Steve Deppe, CMT (@SJD10304) May 19, 2021
$BTC John Wick ?$COIN price quote. pic.twitter.com/u9g1WvEVpM
— Shane C. Murphy (@murphycharts) May 19, 2021
So. Bitcoin fell 53% in five weeks, and then it rallied 35% in four hours. Two observations for now:
1) Nobody in their rate mind would enter into a transaction denominated in bitcoin
2) It's too early to say the bubble's burst (or to say this is a new bull market). pic.twitter.com/ArEaaKVUHC— John Authers (@johnauthers) May 19, 2021
#cryptocurrency is at an all-time high for search interest, Worldwide ? pic.twitter.com/8tMMHhubJz
— GoogleTrends (@GoogleTrends) May 19, 2021
You’re all caught up now. Thanks for reading!