Sponsored By:

Today’s Summary
Wednesday, June 2nd, 2021
Indices: US Stocks closed slightly higher in today’s session. The Dow was flat, changing just 25 points or 0.07%. The S&P 500 and Nasdaq both inched higher by just 0.14%. The Russell 2000 ticked higher by 0.13%.
Sectors: 6 of the 11 sectors closed higher. Energy led, gaining 1.86%. Materials lagged, falling 0.84%.
Commodities: Crude Oil futures continued higher by 1.64% to a new 52-wk high of $68.83 per barrel. Gold futures rose 0.26% to $1,910 per ounce.
Currencies: The US Dollar Index was flat (0.02%).
Interest Rates: The 10-year US Treasury yield fell to 1.588%.
Here are the best charts, articles, and ideas being shared on the web today!
Chart of the Day
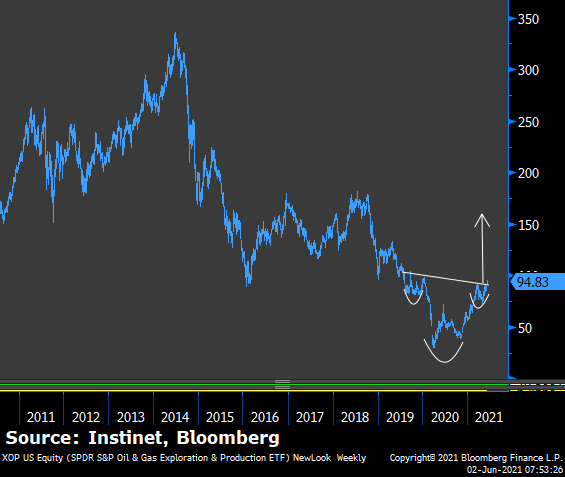
Today’s Chart of the Day was shared in a note by Frank Cappelleri of Instinet (@FrankCappelleri). It’s a weekly chart of the Oil & Gas Exploration & Production ETF, $XOP, over the past decade. The top stocks in this ETF include Range Resources ($RRC), Antero Resources ($AR), Southwestern Energy, Devon Energy ($DVN), and Hess Corp. ($HES). Crude oil is breaking out, and Energy stocks are reaping the benefits. $XOP closed a fresh 52-week high today, but more importantly, it’s breaking out of a bullish pattern on the long-term chart. In the note, Frank explained “From a weekly perspective, XOP nudged through a key downtrend line, completing a sizable two-year bullish inverse Head & Shoulders pattern. Holding above that breakout point would target the $159 area. That’s a lofty objective, but not when it’s framed on a 10-year chart.”
Quote of the Day
“Who owns the future?
This is the question at the heart of every stock market.”
– John Landgraf
Top Links
June Swoon? – LPL Financial Research
The team at LPL Financial Research shares some insightful market commentary as we enter June.
A Breakout for Crude Oil is Bullish for the Energy Sector – Potomac Fund Management
Dan Russo takes a look at the breakout in Crude Oil and more.
Using COT Data to Track The Markets – Andrew Thrasher
Andrew Thrasher explains how to use the Commitment of Traders data to gauge sentiment and positioning within the futures market.
S&P 500 Returns Relative to History – Bespoke
Bespoke examines how the S&P 500’s current performance compares to historical average performance.
Bitcoin Boom & Bust – Timmer: BTC to Bottom at 30k – CNBC
Here’s a great clip from CNBC. Jurrien Timmer of Fidelity offers his technical perspective on Bitcoin and the overall stock market.
Top Tweets
OMG what a snoozer it was today. Summer's here. $SPY pic.twitter.com/xCCtJfzBeP
— Mike Zaccardi, CFA, CMT (@MikeZaccardi) June 2, 2021
Equal-weighted S&P 500 has been outperforming cap-weighted S&P 500 every month this year except April (8 out of 9 prior months)…shift underway since last September, underscoring broader participation & lower concentration risk
[Past performance is no guarantee of future results] pic.twitter.com/bsDGpxWy8C— Liz Ann Sonders (@LizAnnSonders) June 2, 2021
Momentum just got a whole lot cheaper:
• Indexes rebalanced to the best-performing Stocks
• A huge shift to Cyclicals & Value – the new Leaders
• Momentum valuation is now HALF of last year's peakTrading well AND still cheap – Flows will likely follow.
Got Momentum? pic.twitter.com/WC3MlqgjSW
— Macro Charts (@MacroCharts) June 2, 2021
High and tight flag working for $XLK pic.twitter.com/cdSaEIwGQl
— Arthur Hill, CMT (@ArthurHill) June 2, 2021
maybe the rotation trade is just the meme trade$AMC and $GME are the biggest contributors to the Russell 2000’s rally this year
RTY still smokin SPX + NDX in 2021 pic.twitter.com/EKWIfM7icA
— Katie Greifeld (@kgreifeld) June 2, 2021
Crude Oil closed at its highest level since October 2018, up 91% over the last year. pic.twitter.com/F5wUtYnj0E
— Charlie Bilello (@charliebilello) June 2, 2021
Crude oil is breaking out, but oil & gas is as well.
Nice looking chart for a still underinvested area. pic.twitter.com/Qsd3pXPNVb
— Ryan Detrick, CMT (@RyanDetrick) June 2, 2021
I believe this is called 'breakout on volume'. Guessing it's a bullish sign. $OIH pic.twitter.com/Ilx51n6rtS
— Dow (@mark_dow) June 2, 2021
With bitcoin now under pressure, my hunch is that silver and gold are regaining control of the reflation narrative. The chart of silver below suggests a target of $40 on a breakout above $30. (For gold, perhaps around $2200 at the current 5-year real yield of -1.8%.) /END pic.twitter.com/drDeOq11Zw
— Jurrien Timmer (@TimmerFidelity) June 2, 2021
Macro starting to get interesting, some key divergences brewing post the $BTC breakdown. $CRB $GBTC $SPX pic.twitter.com/gmsrbnayFQ
— Arun S. Chopra CFA CMT? (@FusionptCapital) June 2, 2021
10-year T-Note yield has stopped rising, but its not really falling. It's taking a breather and letting the trend catch up before making its next move. Not dissimilar to what we have seen in the past. pic.twitter.com/PWRLdI76qH
— Willie Delwiche (@WillieDelwiche) June 2, 2021
Vai! ?? pic.twitter.com/9kC94QcvYV
— David Rath (@DJwrath) June 2, 2021
If this isn't an indication to get long Brazilian equities, I don't know what is. pic.twitter.com/Ohg0OLq92R
— Brandon Beylo (@marketplunger1) June 2, 2021
You’re all caught up now. Thanks for reading!