Daily Chart Report 📈 Thursday, June 8, 2023
Powered By:

Today’s Summary
Thursday, June 8, 2023
Indices: Nasdaq 100 +1.27% | S&P 500 +0.62% | Dow +0.50% | Russell 2000 -0.41%
Sectors: 7 of the 11 sectors closed higher. Consumer Discretionary led, gaining +1.48%. Real Estate lagged, falling -0.61%.
Commodities: Crude Oil futures fell -1.71% to $71.29 per barrel. Gold futures rose +1.03% to $1,979 per oz.
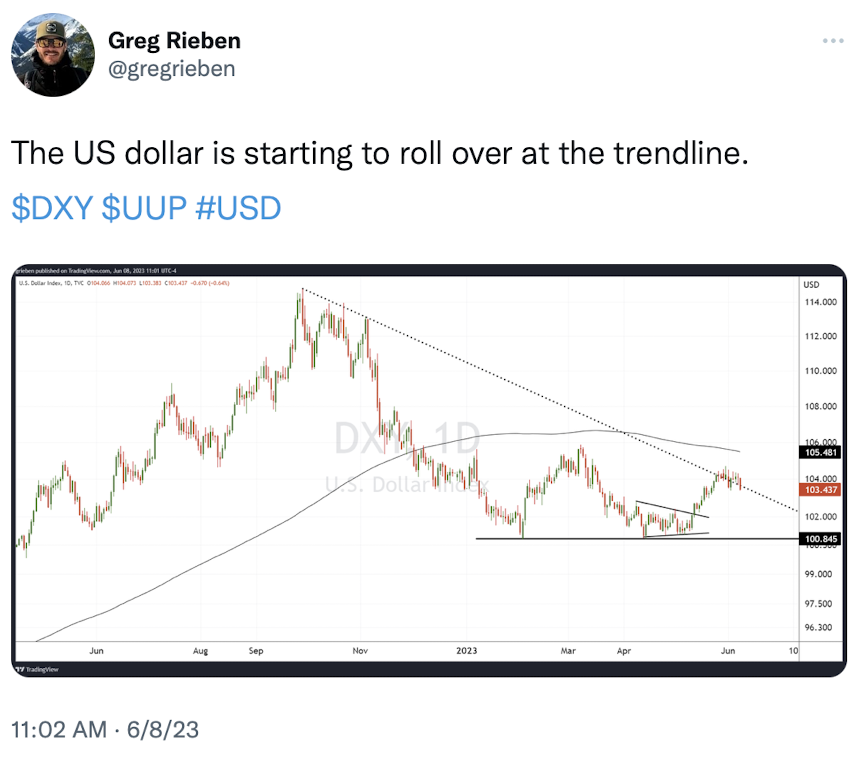
Currencies: The US Dollar Index had its worst day in nearly three months, dropping -0.76% to $103.32.
Crypto: Bitcoin moved higher by +0.61% to $26,508. Ethereum rose +0.73% to $1,846.
Interest Rates: The US 10-year Treasury yield fell to 3.722%.
Here are the best charts, articles, and ideas being shared on the web today!
Chart of the Day
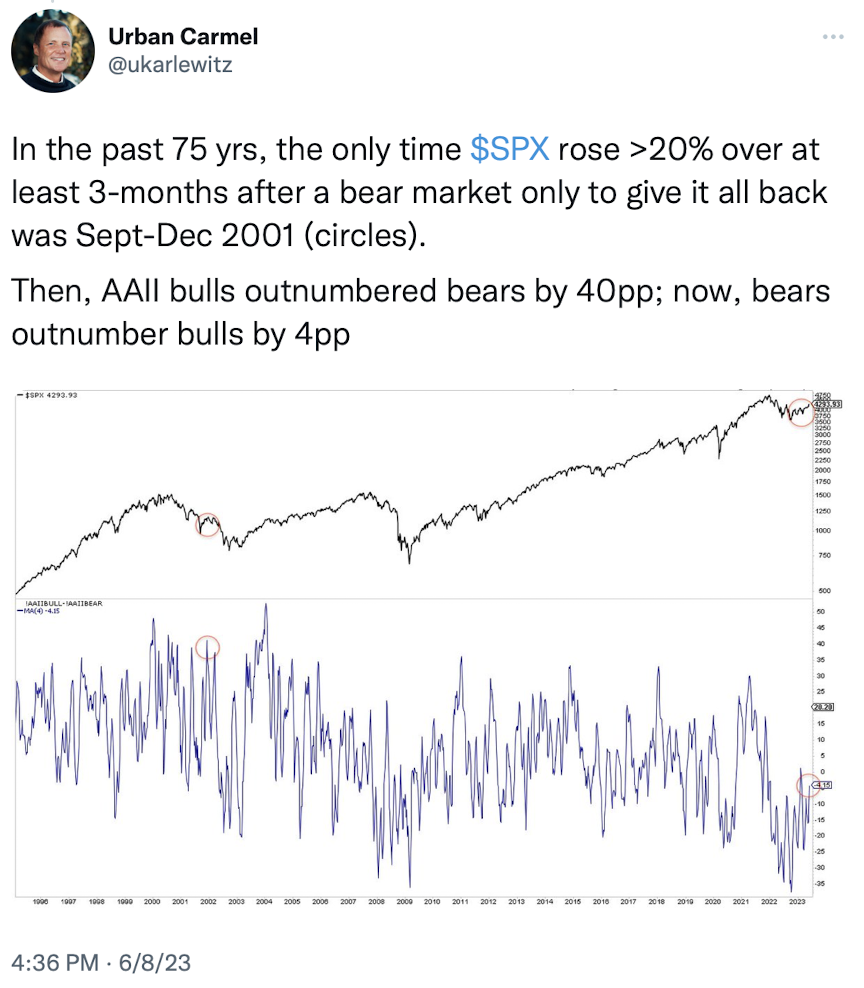
AAII: Bulls now firmly outnumber bears for the first time in 18 months.
Should we run for the hills? In Nov ’20, we saw a similar shift to optimism after 8 months of pessimism. $SPX kept trending higher for the next 12 months.
Follow trends. pic.twitter.com/h2pbgSxvtH
— Brian G (@alphacharts) June 8, 2023
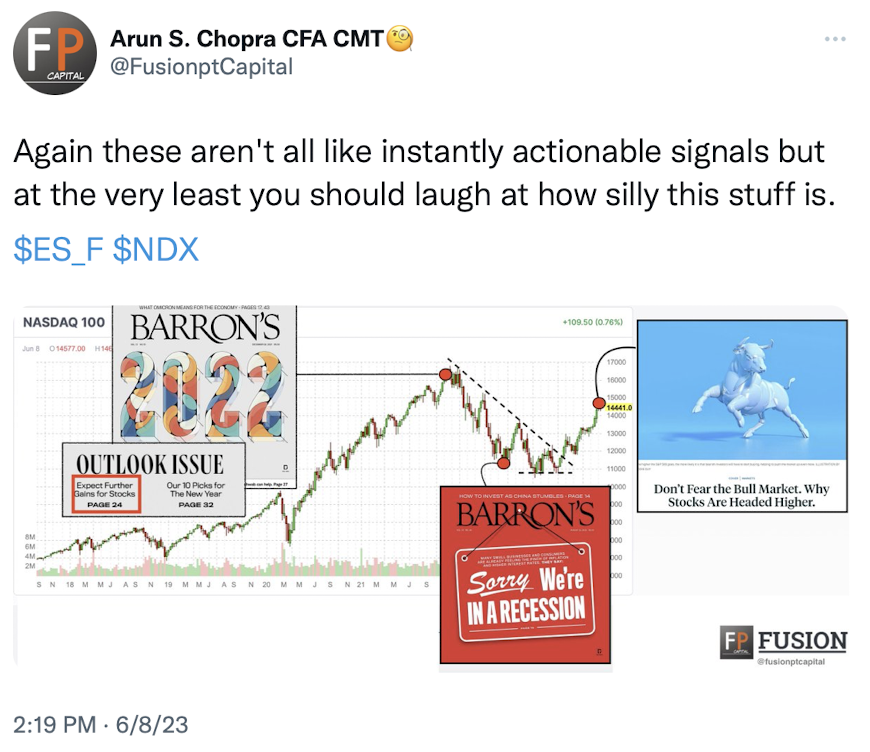
Today’s Chart of the Day was shared by Brian G. (@alphacharts). We’re seeing signs of bullish sentiment returning to the market. For starters, the latest cover of Barron’s features the image of a bull with the headline; “Don’t Fear the Bull Market Why the Stocks are Going Higher.” Secondly, everybody “officially” declared it a new bull market today, with the S&P 500 closing +20% off its October lows. Lastly, Brian points out that the most recent AAII Sentiment Survey reported a huge spike in bullish sentiment, with the bull-bear spread reaching its highest level in 1.5 years. At the same time, other data points like futures positioning and ETF flows suggest that sentiment remains bearish. While sentiment can be an excellent contrarian indicator, it’s most useful at extremes. Given the conflicting data points right now, sentiment is probably not at an extreme.
Quote of the Day
“If you need an indicator to tell you that sentiment is extreme, it’s not.”
– Walter Deemer
Top Links
S&P 500 10-Month Highs | The Morning Show – Stock Market TV
We co-hosted The Morning Show earlier today with Steve Strazza and special guest John Roque of 22V Research. Check it out!
Why Low Volatility Isn’t Bearish – Carson Group
Ryan Detrick looks at what new multi-year lows from the Volatility Index ($VIX) could mean.
Nasdaq Composite Ratio Reaches Counter-Trend Resistance Area – Kimble Charting Solutions
Chris Kimble breaks down a long term ratio chart of the Nasdaq Composite vs. the S&P 500.
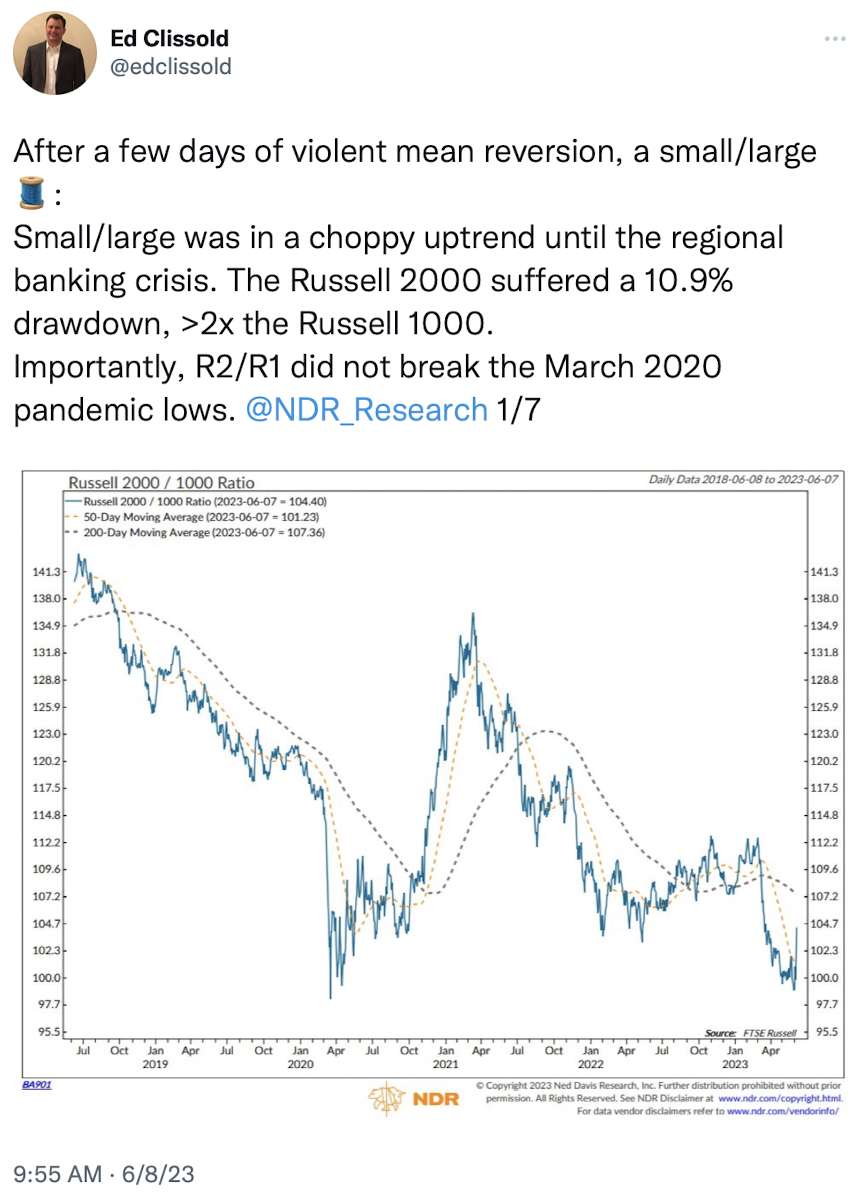
Why Stock Market Investors Should Beware of Chasing Small-Cap Rally – Market Watch
Jonathan Krinsky lays out a few reasons why the recent rally in Small Caps could be short-lived.
The Chart Report is now better than ever…
Introducing The Chart Report: Private Access.
Private Access is everything you love about The Chart Report – plus MORE charts, trade ideas, and access to our exclusive scans and model portfolio updates.

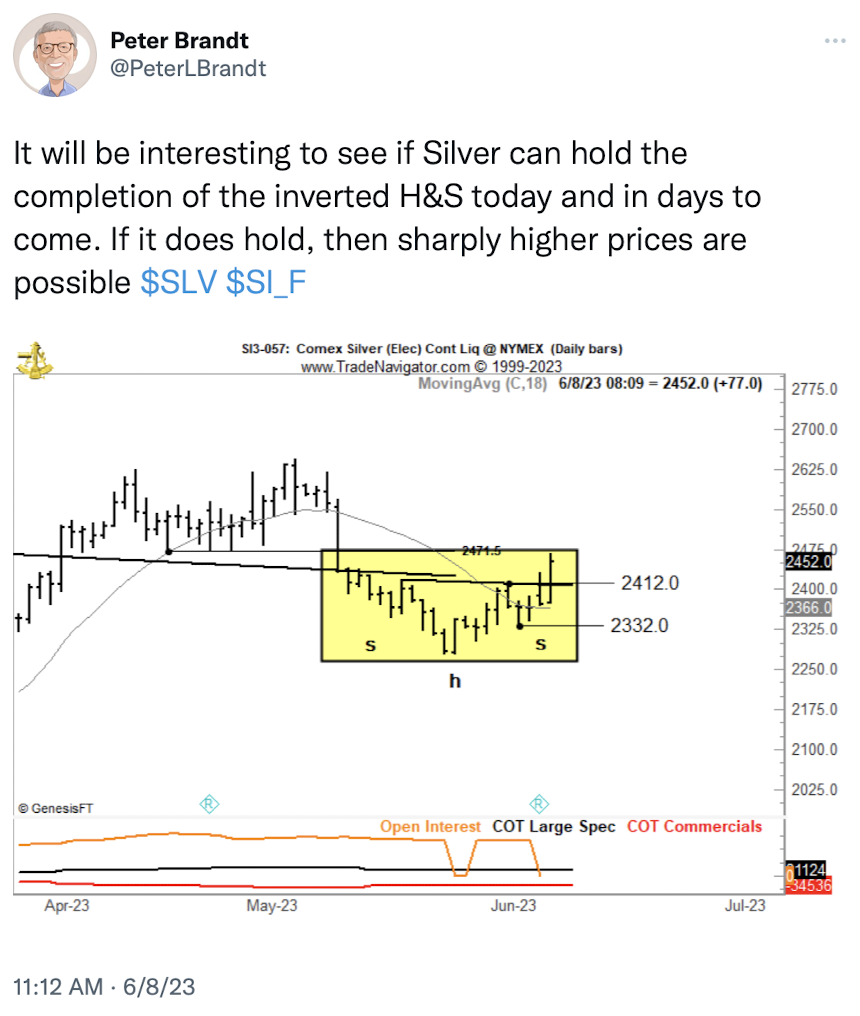
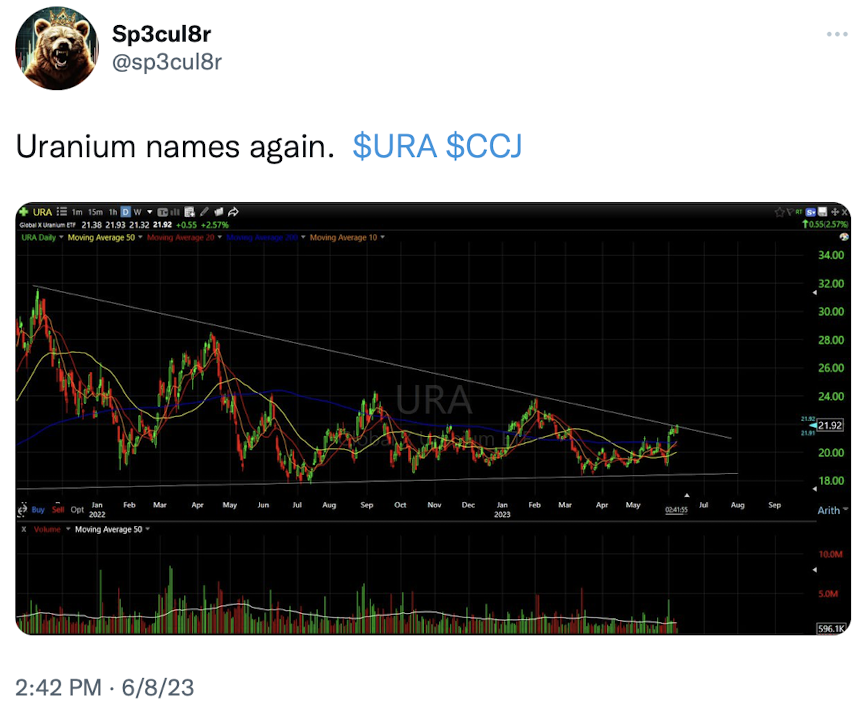
Top Tweets
You’re all caught up now. Thanks for reading!