Sponsored By:

Today’s Summary
Thursday, July 9th, 2020
Indices: US Stocks were mostly lower in today’s session, with the Dow Jones Industrial Average falling 361 points or 1.39%. The S&P 500 slipped 0.56%, while the Nasdaq managed to gain 0.53%. Small-Caps underperformed with the Russell 2000 dropping 2.00%.
Sectors: 9 of the 11 sectors closed lower. Technology led for the second day in a row, rising 0.36%. Energy was the clear laggard, sliding 4.94%.
Commodities: Crude Oil futures dropped 3.20% to $39.59 per barrel. Gold futures moved lower by 0.71% to $1,808.
Currencies: The US Dollar Index rose 0.33%.
Interest Rates: The US 10-year Treasury yield fell to 0.618%.
Here are the best charts, articles, and ideas being shared on the web today!
Chart of the Day
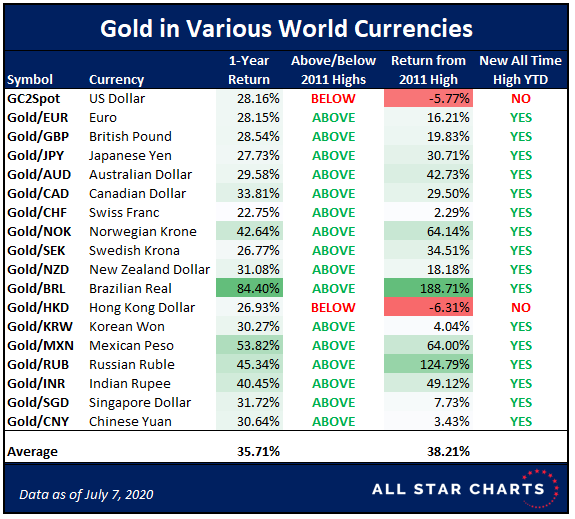
Today’s Chart of the Day was shared in a note from the team at All Star Charts (@allstarcharts). Gold has been in the spotlight lately as it flirts with all-time highs. Why do we care about all-time highs? It’s simple. When price is at an all-time high, there’s little to no overhead supply to act as resistance, leaving the potential for significant upside. Gold peaked in 2011 around $1,900 per ounce, before tumbling about 45% to a low of $1,050 in late 2015. Flash forward to today, and price is just 5% below the 2011 all-time highs. Well, here’s some good news for Precious Metals bulls – Gold is already at an all-time high when we look at Gold priced in other major world currencies. The table shows that Gold is already above its 2011 highs in nearly all of the 18 currencies shown, with the exception of the US and Hong Kong Dollar. Click here to read the full note.
Quote of the Day
“We learn from history that we do not learn from history.”
– Hegel (Philosopher)
Top Links
Jim Cramer Says Use Technical Analysis to Keep Your Emotions in Check – The Street
The notorious Jim Cramer explains why it pays to look at this market from a technical perspective rather than a fundamental one.
Does a Weak First Six Months Mean Trouble? – LPL Financial Research
The team at LPL Financial Research examines how the S&P 500 has historically performed in the second half of the year when the first half of the year was negative.
China Charges Higher – Bespoke
Bespoke checks-in on the rally in Chinese equities, as the CSI 300 notches an eight-day winning streak.
Market Recap Video – Tribecca Trade Group
In this video, Christian Fromhertz highlights some of the strongest stocks, trends, and ETFs across the markets right now.
This BIG (BLUE) Tech Stock is on The Verge of Breaking Lower – StockCharts.com
Julius de Kempenaer takes a look at one tech stock that has failed to keep up with the rest of its sector, and on the verge of breaking down – $IBM.
Top Tweets
Today's Mkt Mood: CONFUSED
– $SPX -.56% & $RTY -2% vs.
– $NDX +.82% & record high!!
– Lots of eggs in $NYFANG +1.5%
– Bonds & dollar up, yen flatThoughts on Tomorrow
– Today's red flags
– $VIX & $VXN abv 200 DMA
– Parabolic mega caps
– $HXC looks a little scary— Abigail Doolittle (@TheChartress) July 9, 2020
3 individual stocks now each >5% weights in the S&P 500. This hasn't occurred in the last 30-years of data. pic.twitter.com/KKcyq3u8gn
— Strategas (@StrategasRP) July 9, 2020
Equity put/call ratio @CBOE hasn’t reached another extreme, but still remains quite low relative to @AAIISentiment bearish readings, which have stayed fairly high since March lows @Bloomberg pic.twitter.com/SWId9Uq8ni
— Liz Ann Sonders (@LizAnnSonders) July 9, 2020
Energy & banking were conspicuous laggards during 1999 tech bubble, not finding relative-strength bottoms until $NDX topped in March 2000. Template for 2020/21? pic.twitter.com/QZ0rLHDIIq
— Mark Ungewitter (@mark_ungewitter) July 9, 2020
Crude Oil's ongoing battle with overhead resistance will likely continue to depress the energy sector.$CL_F $XLE $OIH $XOP pic.twitter.com/VZaZ98fPhS
— Matthew Timpane, CMT (@mtimpane) July 9, 2020
Following the smallest 5-day range for US crude oil (August contract) since mid-February, we seem to have a tentative – but provocative – bearish break. But will it find follow through? pic.twitter.com/w8Kh1Eg7eI
— John Kicklighter (@JohnKicklighter) July 9, 2020
The gold:silver ratio has been in a downtrend since the 126.50 blowoff top in March. Since then: Breakdown, bear flag/breakdown, bear flag/breakdown inside of a falling channel. #Silver outperforming #gold is healthy for the metals bull case. Next stop 93 followed by 83 $GLD $SLV pic.twitter.com/sYH9jDkRuu
— Tarek I. Saab (@FibLines) July 9, 2020
#Copper is back to its January high! pic.twitter.com/k3ompPPhlD
— jeroen blokland (@jsblokland) July 9, 2020
— Arun S. Chopra CFA CMT? (@FusionptCapital) July 8, 2020
Lumber another new contract high, copper – 80 cent rally and still going, beans just getting started…"I don't smell no stinkin inflation on the horizon, do you?" pic.twitter.com/3PDTARg5k2
— Linda Raschke (@LindaRaschke) July 9, 2020
Russell, your looks have become a problem. pic.twitter.com/0K3ZDoEQm2
— Dan Nathan (@RiskReversal) July 9, 2020