Powered By:
Today’s Summary
Thursday, August 3, 2023
Indices: Nasdaq -0.11% | Dow -0.19% | S&P 500 -0.26% | Russell 2000 -0.28%
Sectors: 3 of the 11 sectors closed higher. Energy led, rising +1.01%. Utilities lagged, dropping -2.28%.
Commodities: Crude Oil futures gained +2.59% to $81.55 per barrel. Gold futures fell -0.31% to $1,969 per oz.
Currencies: The US Dollar Index snapped a five-day winning streak, inching lower by -0.10% to $102.49.
Crypto: Bitcoin was flat and continues to trade around $29,187. Ethereum was also flat and continues to trade around $1,836.
Interest Rates: The US 10-year Treasury yield rose to an eight month high of 4.181%.
Here are the best charts, articles, and ideas shared on the web today!
Chart of the Day
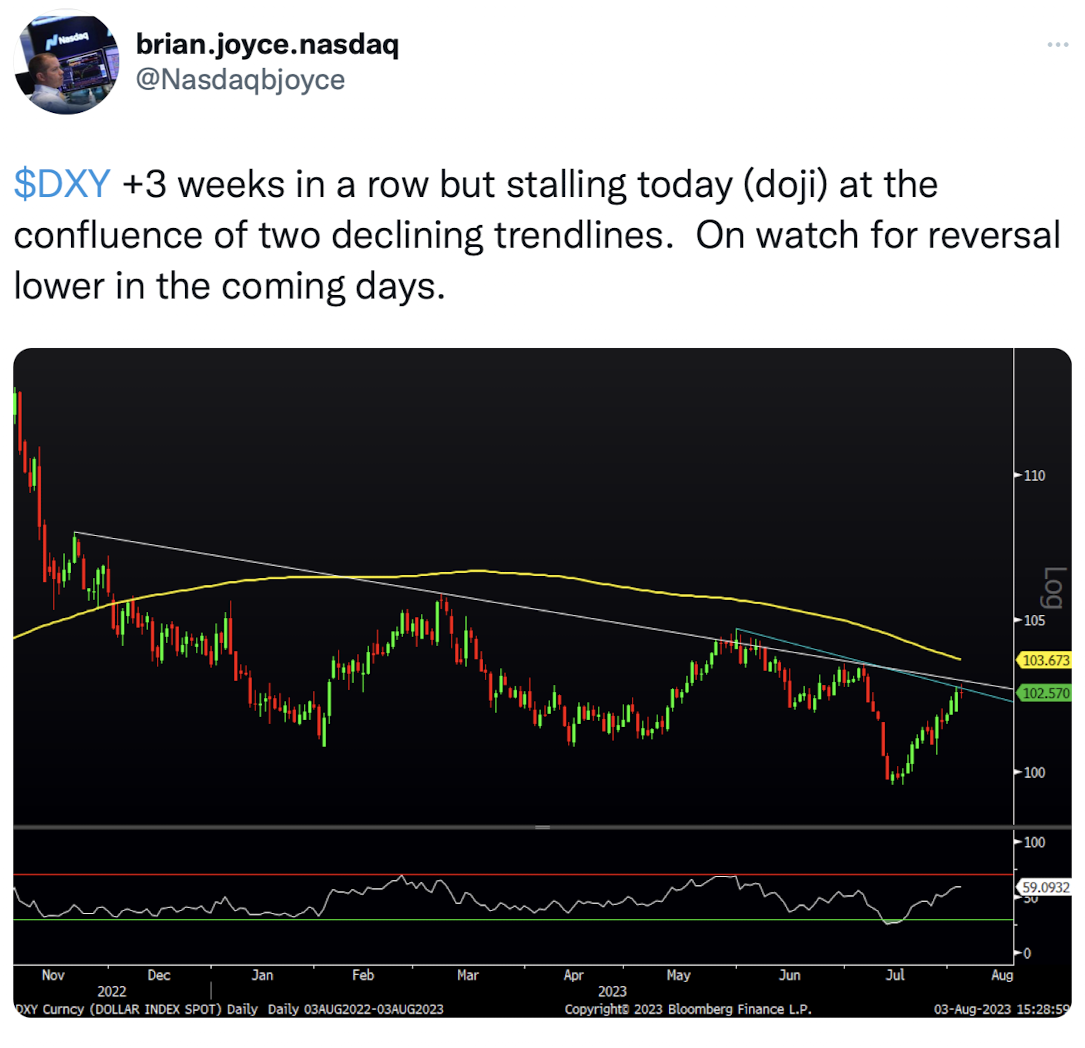
Today’s Chart of the Day was shared by Brian Joyce (@Nasdaqbjoyce). The Dollar Index ($DXY) is at a crossroads again, and the next move for stocks could hinge on the path it takes. $DXY broke down to a 15-month low three weeks ago, after violating the February/April lows, around $101. However, that breakdown is failing as price has reclaimed the prior lows. It snapped a five-day winning streak today but only fell -0.10%. Brian points out that today’s flattish price action created a Doji candle at a confluence of resistance from two downward-sloping trendlines. Doji candles represent a brief moment of equilibrium between buyers and sellers before an eventual imbalance. If $DXY resolves higher, it would likely put pressure on stocks, while an inflection lower could act as a tailwind.
Quote of the Day
“Divergences are like laxatives. You never know if one is enough or two is too many.”
– Justin Mamis
Top Links
Charts Say Pullback Should Be Followed By Higher Highs – Ciovacco Capital Management
Chris Ciovacco analyzes the short-term and long-term trend for stock.
Will Rising Rates Lead to a Stock Market Bloodbath? – All Star Charts
Ian Culley looks at what the resurgence in interest rates could mean for stocks.
Another Hot July. Another Late-Summer/Autumn Buy? – Almanac Trader
Jeff Hirsch points out that outsized gains in July have historically been followed by a sell-off in late-Summer/Autumn.
Sentiment Swings Higher Despite Decline – Bespoke
Bespoke breaks down the results of the latest AAII Sentiment Survey.
Are Tech Stocks About to Falter or Ready to Lead Again? – Kimble Charting Solutions
Chris Kimble examines a long-term ratio chart of the Nasdaq Composite vs. the S&P 500.
Top Tweets
August is off to a shaky start. Three down days in a row. Total loss of -1.90%.
— Eddy Elfenbein (@EddyElfenbein) August 3, 2023
The S&P500 was very strong during a time that it is supposed to be strong. Not sure why everyone was so surprised about it. And now S&Ps are entering a seasonally weak period of the cycle. You can ignore that if you want to. I won't. pic.twitter.com/aDc4N6dUVa
— J.C. Parets (@allstarcharts) August 3, 2023
AAII sentiment survey: fewest bears in 2+ years. pic.twitter.com/z9D4IILtDy
— Willie Delwiche, CMT, CFA (@WillieDelwiche) August 3, 2023
A critically important change may be triggering in Stocks:
Yesterday's sharp decline broke the S&P's longest low-Volatility streak in years.
Many similar breaks ended with some big Volatility spikes & Stock declines.
This week's break is *timely* AND seems related to the many… pic.twitter.com/TzoufyCTvN
— Macro Charts (@MacroCharts) August 3, 2023
Knock, knock. pic.twitter.com/uzah4wUaf3
— Frank Cappelleri (@FrankCappelleri) August 3, 2023
Can oil hold above $80? Since falling below $80 in late 2022, that area has served as resistance in 2023. Crude got near or a bit above it on five separate occasions before falling once again. Will this time be different? pic.twitter.com/2Qj15bM6Bz
— Liz Young (@LizYoungStrat) August 3, 2023
Oil vol lowest since Jan '20 $OVX pic.twitter.com/0Z4aeJzP3w
— Mike Zaccardi, CFA, CMT 🍖 (@MikeZaccardi) August 3, 2023
The 30-year is up 30 bps in the last 48 hours.
(For those not deep into the bond market … this is a huge move.) pic.twitter.com/Uf3wYiJBY7
— Jim Bianco (@biancoresearch) August 3, 2023
Yo, Charts — pic.twitter.com/R85T0bSGtf
— da Chart Life (@daChartLife) August 3, 2023
Are yields getting enough attention? This week's run up will impact corporate profitability, stymie capex, hurt credit conditions, increase the Federal deficit, and create more competition for stocks. This indicator will likely go negative with the next weekly update. pic.twitter.com/qS7m7nZqQ8
— Day Hagan Asset Management (@DayHagan_Invest) August 3, 2023
U.S. long bond: full reversion scenario. Not a forecast. pic.twitter.com/ARKDZe9t8E
— Mark Ungewitter (@mark_ungewitter) August 3, 2023