Sponsored By:

Today’s Summary
Friday, August 5th, 2022
Indices: Russell 2000 +0.81% | Dow +0.23% | S&P 500 -0.16% | Nasdaq 100 -0.78%
Sectors: 5 of the 11 sectors closed higher. Energy led, gaining +1.98%. Consumer Discretionary lagged, falling -1.70%.
Commodities: Crude Oil futures were flat and continue to trade at $88.53 per barrel. Gold futures dropped -0.89% to $1,792 per ounce.
Currencies: The US Dollar Index rose +0.78%.
Crypto: Bitcoin rose +2.51% to $23,179. Ethereum gained +6.09% to $1,705.
Interest Rates: The US 10-year Treasury yield rose to 2.832%.
Here are the best charts, articles, and ideas being shared on the web today!
Chart of the Day
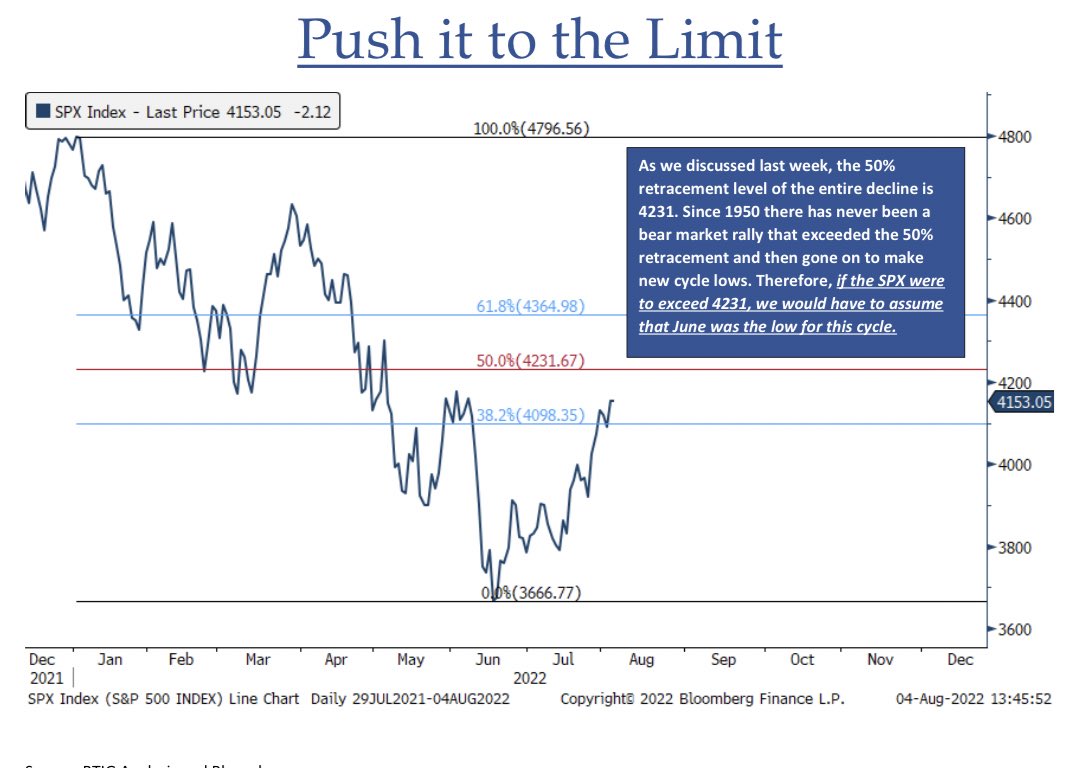
Today’s Chart of the Day was shared by Jonathan Krinsky (@jkrinskypga). It’s a chart of the S&P 500 since the end of December. The level in red, around 4231, represents the 50% retracement of this year’s decline. Jonathan points out that a potential break above the 50% retracement could signal the start of a new bull market. He notes, “Since 1950 there has never been a bear market rally that exceeded the 50% retracement and then gone on to make new cycle lows. Therefore if the SPX were to exceed 4231, we would have to assume that June was the low for this cycle.”
Quote of the Day
“Some of the best memories are made in flip-flops.”
– Kellie Elmore
Trendlines Over Headlines
In this week’s episode of Trendlines Over Headlines, Chief Market Strategist, Ryan Detrick of Carson Group joins us to talk Seasonality, The 4-year Presidential Cycle, and more!
Top Links
The Downside Risk in Energy – All Star Charts
Ian Culley examines the outlook for Energy stocks.
Crazy Moves in the Bond Market
Bespoke takes a look at this week’s volatility in Bonds ($TLT).
Stock Market Analysis August 5, 2022 – Brian Shannon
Brian Shannon breaks down this week’s price action and lays out a few levels to watch next week.
Fill the Gap Episode Twenty with David Keller, CMT – The CMT Association
In this podcast, Tyler Wood and David Lundgren sit down with David Keller to discuss the current market environment and more.
Top Tweets
S&P 500 almost perfectly flat on the week pic.twitter.com/NknyI7bhhp
— Katie Greifeld (@kgreifeld) August 5, 2022
Futures getting rejected again at 4180…$ES_F $SPX $SPY pic.twitter.com/gBiuKvJN64
— Ian McMillan, CMT (@the_chart_life) August 5, 2022
Looks like step 1 accomplished for $IWM on the weekly pic.twitter.com/5SoiRbDaEu
— Mike Zaccardi, CFA, CMT (@MikeZaccardi) August 5, 2022
#NQ_F, 4h
Resistance. pic.twitter.com/fg0wZzzE06
— Yuriy Matso (@yuriymatso) August 5, 2022
Here's a long-term view of bear market rallies. This is basically the opposite of an underwater chart, measuring rallies off of drawdown lows that go back down to make new lows. pic.twitter.com/uBe5fprgyb
— Nick Reece (@nicholastreece) August 5, 2022
New 52 week highs list pic.twitter.com/pYgObWXHwH
— Traderstewie (@traderstewie) August 5, 2022
$XBI Weekly. Amazing +40% move off major support in just 8 weeks. Now approaching a resistance zone. pic.twitter.com/VD6FRC8vQe
— Brian G (@alphacharts) August 5, 2022
This chart is one that doesn't ? look investor friendly ?Notice in 2000 & 2007 where the top panel is, then see where the stock market low is. It is well after the yield spread has flipped➕. $SPY $QQQ $NDX $SPX $XHB #RecessionWatch $TNX $FVX
More –> https://t.co/mlf75yawzj pic.twitter.com/jZjjKg3LSr— Greg Schnell, CMT (@Schnellinvestor) August 5, 2022
Risk is to the downside for gasoline futures. $RB_F pic.twitter.com/yuC7X5R1Hi
— Ian Culley (@IanCulley) August 5, 2022
$BTC still glued to 23k, wild. At least you know whichever way it breaks is the deal pic.twitter.com/jyNI3Pw2Il
— Oliver Renick (@OJRenick) August 5, 2022
Ok. pic.twitter.com/fJyPHKmkx3
— Arun S. Chopra CFA CMT? (@FusionptCapital) August 5, 2022
You’re all caught up now. Thanks for reading!