Sponsored By:
![]()
Today’s Summary
Tuesday, August 13th, 2019
Indices: US stocks were higher in today’s session with the Dow Jones Industrial Average gaining 373 points or 1.44%. The Nasdaq outperformed the rest of the major indices, gaining 1.95%.
Sectors: All 11 sectors of the S&P 500 were higher. Technology led, gaining 2.52%. Financials lagged but still inched higher by 0.05%.
Commodities: Crude Oil futures rose 3.84% to $57.07 per barrel. Gold futures fell 0.20% to $1,514 per ounce.
Currencies: The US Dollar Index gained 0.46%.
Interest Rates: The US 10-year Treasury yield moved higher to 1.702%.
Here are the best charts, articles, and ideas being shared on the web today!
Chart of the Day
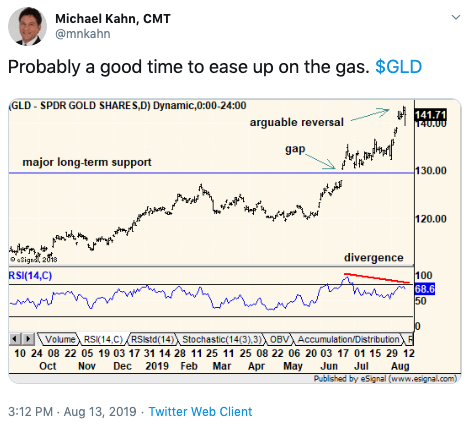
Today’s Chart of the Day was shared on Twitter by Michael Kahn (@mnkahn). It’s a daily bar chart of Gold over the past year. Gold has had a terrific run this year and is actually outperforming the S&P 500 year-to-date. Michael notes that it may be a good time to “ease up on the gas” because the chart is showing a bearish RSI divergence as well as a reversal pattern. A bearish RSI divergence occurs when price makes a new high while RSI fails to make a new high. In addition to the reasons Michael laid out, sentiment on Gold is beginning to reach extremely bullish levels, which is actually a bearish sign that the trade is crowded. We’ve been bullish on Gold and think that this is potentially the beginning of a bull market in Precious Metals. However, in the short-term, Gold looks like it needs some time to cool off and digest its recent gains.
Quote of The Day
Top Links
Trendless Markets – The Chart Report
In this report, we address the flat 200-day moving average on the S&P 500 and the trendless environment that stocks have been stuck in for over a year now.
Betting on Clean Energy – Real Vision
Technical Analyst, Rick Bensignor made an appearance on Real Vision today to share a trade idea on the Clean Energy ETF, $PBW.
Stay Away From European Banks, Says Technical Analyst – CNBC
In this clip from CNBC, Ari Wald of Oppenheimer shares his thoughts on European Banks and tells investors to avoid buying them.
5 Signs the Stock Market is Terrified – Schaeffer’s Investment Research
Here’s an interesting note from Schaeffer’s, that examines five different sentiment indicators that are currently showing signs of “extreme fear” in the US stock market.
U.S Banks are Hitting Foul Balls: Technical Analyst – BNN Bloomberg
Todd Sohn of Strategas Research Partners discusses the current market environment. He touches on Banks, Bonds, and some of the individual sectors of the S&P 500.
Top 10 Tweets
Large caps continue to be the name of the game pic.twitter.com/R8Wk14wK1H
— Liz Ann Sonders (@LizAnnSonders) August 13, 2019
I think most of us would agree that $SPX option sellers have had a rough go since 2018. Just how rough you ask?
Let's compare a strategy that buys 7d ATM calls to one that sells 7d ATM puts (rolled with 1DTE). This is the growth of $1mm portfolio trading 5 contracts. pic.twitter.com/ktVjxNzQQW
— Pat Hennessy, CMT (@pat_hennessy) August 1, 2019
Bulls would be happier if the fins started to generate some relative strength: pic.twitter.com/PDRcKKZRy2
— Walter Deemer (@WalterDeemer) August 13, 2019
I like to take what I consider the "Offensive Sectors" and compare them to my "Defensive Sectors". Both baskets equally-weighted: Financials, Tech & Discretionary vs Staples Utes & Healthcare $XLF $XLK $XLY $XLP $XLU $XLV – Will Ratio confirm $SPX or was that "THE" divergence? pic.twitter.com/I6wCLArZrU
— J.C. Parets (@allstarcharts) August 13, 2019
Bills vs. $SPY Weekly pic.twitter.com/VXreVJxanC
— Chris Ciovacco (@CiovaccoCapital) August 13, 2019
The 30-year did make a new all-time low out to three decimal places. Equaled its July 8, 2016 all-time low out to two decimal places.
No other point on the yield curve is close to new all-time lows.
So the US begins to join the rest of the world making new all-time-lows. pic.twitter.com/eSumU7yzJ0
— Jim Bianco (@biancoresearch) August 13, 2019
$TWTR strong today. Daily chart looks great. pic.twitter.com/xNAZkNsisA
— Jack Damn (@JackDamn) August 13, 2019
$TEAM one of the strongest and most resilient charts out there pic.twitter.com/ivNCyzI4PE
— BostonCharts (@bostonchaahhts) August 13, 2019
$VFF has really turned into a marijuana leader pic.twitter.com/WrP6UqarxP
— Aaron (@ATMcharts) August 13, 2019
Google Trends "negative yield." Presented without comment. pic.twitter.com/HVICUvqMjl
— Mark Ungewitter (@mark_ungewitter) August 13, 2019
Upcoming Events
August 12th-18th – Chart Pattern Beauty Competition – Post your best chart to Twitter using the hashtag: #TrendSpiderContest19 to win a $100 Amazon Gift Card and more! Click here for details.
You’re all caught up now. Thanks for reading!