eSponsored By:
![]()
Today’s Summary
Wednesday, August 21st, 2019
Indices: US stocks were higher in today’s session with the Dow Jones Industrial Average closing higher by 240 points or 0.93%. The S&P 500 and Nasdaq rose 0.82% and 0.90%, respectively.
Sectors: All 11 sectors of the S&P 500 were positive. Consumer Discretionary led for the second day in a row, gaining 1.93%. Consumer Staples lagged but still closed higher by 0.30%.
Commodities: Crude Oil futures fell 0.82% to $55.65 per barrel. Gold futures were relatively unchanged for the second straight day and continue to trade around $1,516 per ounce.
Currencies: The US Dollar Index rose 0.12%.
Interest Rates: The US 10-year Treasury yield moved higher to 1.591%.
Here are the best charts, articles, and ideas being shared on the web today!
Chart of the Day
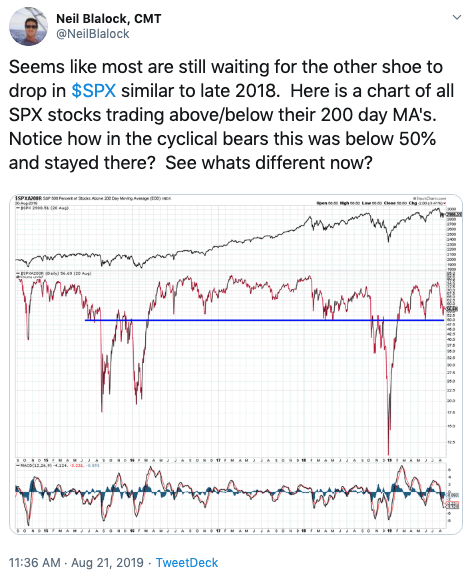
Today’s Chart of the Day was shared on Twitter by Neil Blalock (@NeilBlalock). It’s a chart of the percentage of stocks in the S&P 500 trading above their 200-day moving average. Neil points out that in the past two cyclical bear markets, (2015-2016 and Q4 2018) this indicator fell below 50% and stayed there until the market was able to resume its uptrend. On the other hand, in periods where the market was moving higher, this indicator held above 50%. Even during pullbacks like the one we saw in May, it remained above 50% and the S&P 500 went on to make all-time highs. The current reading is around 57%. Clearly, 50% is an important line in the sand for this breadth indicator and bulls will need it to hold in order for the market to move higher. You can track this indicator on StockCharts.com using the symbol $SPXA200R.
Quote of The Day
Top Links
Bond Market Ratio Shows Strength from Treasuries – The Chart Report
In this weeks Chart of the Week column, we take a look at the ratio of Junk Bonds to US Treasury Bonds and what it could be suggesting for Stocks.
The Inverted Yield Curve is Actually Bullish – Talk Markets
Here’s a unique take on the recent yield curve inversion from Technical Analyst, Michael Kahn. He argues that the way in which the curve flattened was different this time around and that it’s actually a positive sign for the US Economy.
Yes, It’s Still Premature to Sell Stocks – Schaeffer’s Investment Research
Matthew Timpane of Schaefer’s Investment Research outlines several short-term buy signals.
Pound Could Be Poised to Reverse Higher, Hedge Fund Telemetry’s Thronton Says – Bloomberg
Tom Thorton of Hedge Fund Telemetry joined host, Abigail Doolittle on Bloomberg today to share his thoughts on the British Pound.
Mirror, Mirror on the Wall, What’s the Strongest Industry Group ETF of All? – StockCharts.com
Arthur Hill of StockCharts.com takes a look at two industry groups within the Consumer Discretionary sector that are trending in opposite directions, Retail ($XRT) and Home Construction ($ITB).
Top 10 Tweets
$SPX posts its fourth hearty gap higher on the open in five trading days. You can hear the collective rumblings among long-only investors: 'you better not ruin this for me Powell' pic.twitter.com/yxBnTlmzE4
— John Kicklighter (@JohnKicklighter) August 21, 2019
The Dow hit a 30-day low last week and since then it's seen two days with every member rising (if today holds).
Over nearly 25 years of history, that's happened 7 other times, all since the financial crisis. All were higher 2-3 months later. pic.twitter.com/0eyR6UCW4n
— SentimenTrader (@sentimentrader) August 21, 2019
I would argue that the Dow Transports $TRAN remaining above 9700 should be a key piece in the #bullish argument. $SPX $SPY #dowtheory pic.twitter.com/tH0X03Cq0p
— David Keller, CMT (@DKellerCMT) August 21, 2019
The last time recession searches spiked, $SPX was falling 13.5% from lower highs in 12/07. The 50-day MA had crossed below the 200-day MA. Considering, we're only 3% lower from ATHs, investor sentiment is already extremely bearish and recession searches are spiking again…(1/2) pic.twitter.com/7nYI3D8FwV
— David Settle, CMT (@davidsettle42) August 21, 2019
NYSE Oil & Gas Index $XOI Testing Post-2016 Up Trendline $XLE #TrendlineWednesday pic.twitter.com/nHRZbWtMy0
— Dana Lyons (@JLyonsFundMgmt) August 21, 2019
$VIX breaking down today. Confirmed swing low. pic.twitter.com/V0IsuIlwJ1
— Jack Damn (@JackDamn) August 21, 2019
$VIX 15 handle for the first time since Aug 1st pic.twitter.com/n4TzvD3b4T
— Tom Hearden (@followtheh) August 21, 2019
Lots of focus on the dollar right now but I don't see it as being at a critical juncture. It's little-changed over the past year and has generally moved sideways within a broad range since 2015. Currently above where it was in early 2018 but below where it was in early 2017. pic.twitter.com/LhtQIDbI3I
— Willie Delwiche (@WillieDelwiche) August 21, 2019
Coffee creating a double bottom at (1)? Going to perk up and breakout at (2)? $JO $DBC @MarketSmith @InvestorsBusinessDaily #IBDpartner #IBDinfluencer https://t.co/kSPRsbQbtw pic.twitter.com/WAXvwo75u1
— Chris Kimble (@KimbleCharting) August 21, 2019
1yr Perf chart of $WMT / $TGT vs $AMZN
Great American companies fight BACK against being disrupted pic.twitter.com/qPR7RFXCoz
— Michael Antonelli (@BullandBaird) August 21, 2019
You’re all caught up now. Thanks for reading!