Sponsored By:
![]()
Today’s Summary
Tuesday, August 27th, 2019
Indices: US stocks closed lower in today’s session with the Dow Jones Industrial Average falling 121 points or 0.47%. The Russell 2000 was significantly weaker than the rest of the major indices, slipping 1.35%.
Sectors: Communications led, gaining 0.19%. Energy lagged, falling 0.62%.
Commodities: Crude Oil futures rose 2.35% to $54.89 per barrel. Gold futures climbed 0.94% to a new multi-year high of $1,552 per ounce.
Currencies: The US Dollar Index inched lower by 0.06%.
Interest Rates: The US 10-year Treasury yield moved lower to 1.473%.
Here are the best charts, articles, and ideas being shared on the web today!
Chart of the Day
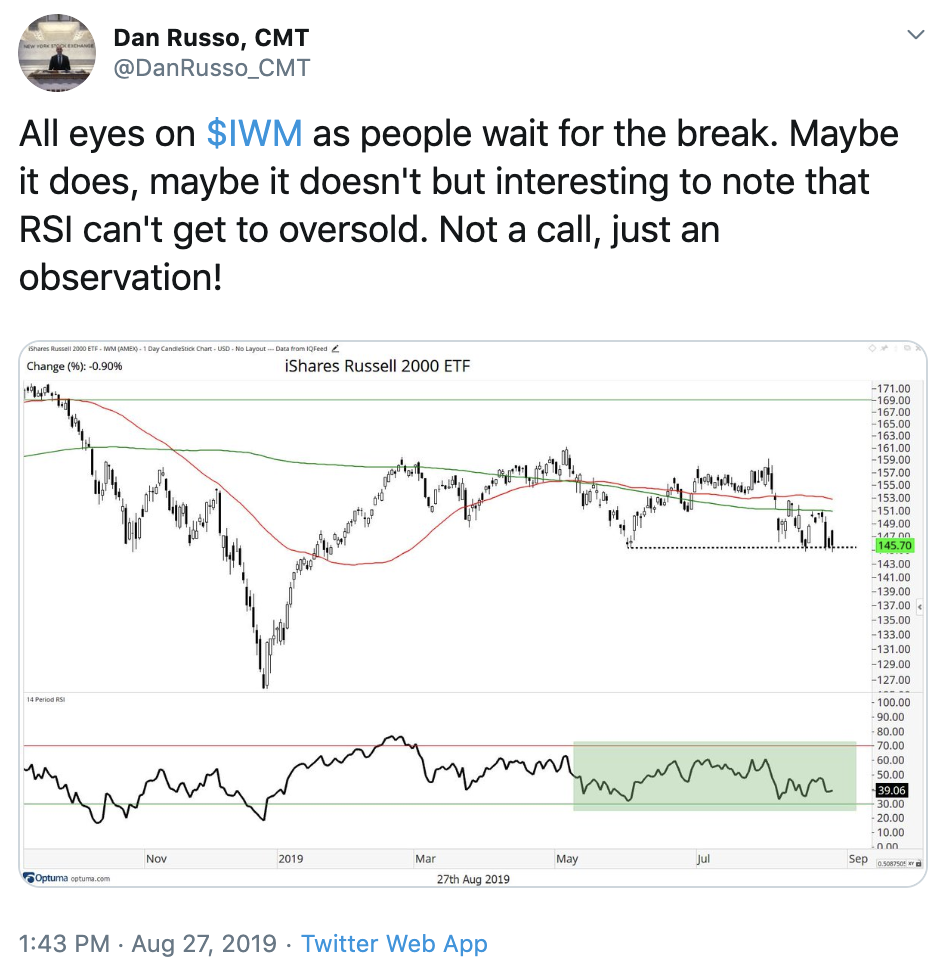
Today’s Chart of the Day was shared on Twitter by Dan Russo of Chaikin Analytics (@DanRusso_CMT). It’s a daily candlestick chart of the Small-cap Russell 2000 index over the past year. The Russell 2000 has been in focus recently as it continues to underperform the other major indices. Today, it fell below the June low and closed at the lowest level since mid-January. Relative weakness from Small-cap stocks is undoubtedly an area for concern for the overall market because it indicates a lack of risk appetite. Dan points out that one positive development on this chart is the fact that RSI never reached oversold levels. Small-caps will need to catch a bid soon for the broader market to continue higher.
Quote of The Day
Top Links
The Most Important Indicator Right Now – The Chart Report
In this report, we examine a popular breadth indicator that’s worth paying attention to right now; the percentage of stocks above their 200-day moving average.
Tribeca Trade Group’s Fromhertz Likes Software Stocks Amid Trade War – Bloomberg
Christian Fromhertz made an appearance on Bloomberg yesterday to discuss why he likes the Software ETF, $IGV. He outlines an options trade to take advantage of further upside from this ETF.
Preparing for Financial ̶ ̶A̶p̶o̶c̶a̶l̶y̶p̶s̶e̶ ̶ Prosperity – Omaha Charts
Here’s a good read from Trent Smalley of Omaha Charts. He talks about why long-term investors should ignore the headlines and embrace drawdowns as a buying opportunity.
Ups and Downs in a Bull Market are Normal, Strategist Says – CNBC
In this clip from CNBC, Ryan Detrick of LPL Financial Research weighs in on the recent volatility. He explains that this is a perfectly normal price action for the stock market despite the uncertain economic backdrop.
An “All-American” Pocket of Strength in an Otherwise Tough Market – StockCharts.com
In this piece, Mary Ellen McGonagle of StockCharts.com points out the relative strength shes seeing from Restaurant stocks. She takes a look at three stocks, in particular, Wendy’s ($WEN), Chipotle ($CMG), and WingStop ($WING).
Top 10 Tweets
The Ratio of Small Caps to Large Caps is at its lowest level since June 2003. $IWM $SPY pic.twitter.com/Jyt9P6vHK3
— Charlie Bilello (@charliebilello) August 27, 2019
Small Caps threatening a lower low as it breaks past the May 31st low and testing the August low. $IWM pic.twitter.com/41UdUcF5ql
— Andrew Thrasher, CMT (@AndrewThrasher) August 27, 2019
Small caps about to break down here $RUT $IWM. Listen to the consistent, persistent message coming from the markets: Lots of rot/sickness behind the scenes vs. the $SPX's modest "off the highs" dip pic.twitter.com/osJhpDM1gY
— Mike Larson (@RealMikeLarson) August 27, 2019
S&P 500 up 16% in 2019, w/ REITs leading way (+28%), w/ Tech not far behind (+27%); low vol at top of table for equity factors (22%) @SPGlobal pic.twitter.com/sYrOOPnQYE
— Liz Ann Sonders (@LizAnnSonders) August 27, 2019
$TRAN low close since mid Jan pic.twitter.com/WpEyd00CtR
— Tom Hearden (@followtheh) August 27, 2019
Quite a change of character for $SPX & $VIX after 2018 pic.twitter.com/QG8KwtU4H0
— Matt Thompson, CFA (@dynamicvol) August 26, 2019
Add this #Bloomberg chart — showing the recent moves in yields on various maturities of US government #bonds and bills — to the pile of once-unthinkable/unlikely outcomes that have become reality. And its a phenomenon that speaks to several points/lines on the chart.
#markets pic.twitter.com/UqmIl7iNoS— Mohamed A. El-Erian (@elerianm) August 27, 2019
2s10s is well and truly inverted.
-2.75
No more "but it didn't close" nonsense. pic.twitter.com/s2CXxxf2JZ
— Michael Antonelli (@BullandBaird) August 27, 2019
European Financials.
Been a mess for a while now.
Waiting for resolution out of this compression/consolidation.$EUFN pic.twitter.com/FtINbGLuaM— David Zarling (@360research) August 27, 2019
For the first time in 9 years, money is a net outflow from shares of $TSLA as measured from the day they came public.
The daily inset chart shows sellers have also regained control from the last test of a 5 yr trendline. Sell the R.I.P.'s pic.twitter.com/uUokv9va1D
— Brian Shannon, CMT (@alphatrends) August 27, 2019
You’re all caught up now. Thanks for reading!