Sponsored By:
![]()
Today’s Summary
Wednesday, August 28th, 2019
Indices: US stocks were higher in today’s session with the Dow Jones Industrial Average gaining 258 points or 1.00%. The Russell 2000 was the strongest of the major indices, advancing 1.15%.
Sectors: Energy led, gaining 1.43%. Utilities were the only sector to close negative, falling 0.27%.
Commodities: Crude Oil futures rose 1.58% to $55.76 per barrel. Gold futures inched lower by 0.15% to $1,549 per ounce.
Currencies: The US Dollar Index was higher by 0.22%.
Interest Rates: The US 10-year Treasury yield moved lower to 1.468%.
Here are the best charts, articles, and ideas being shared on the web today!
Chart of the Day
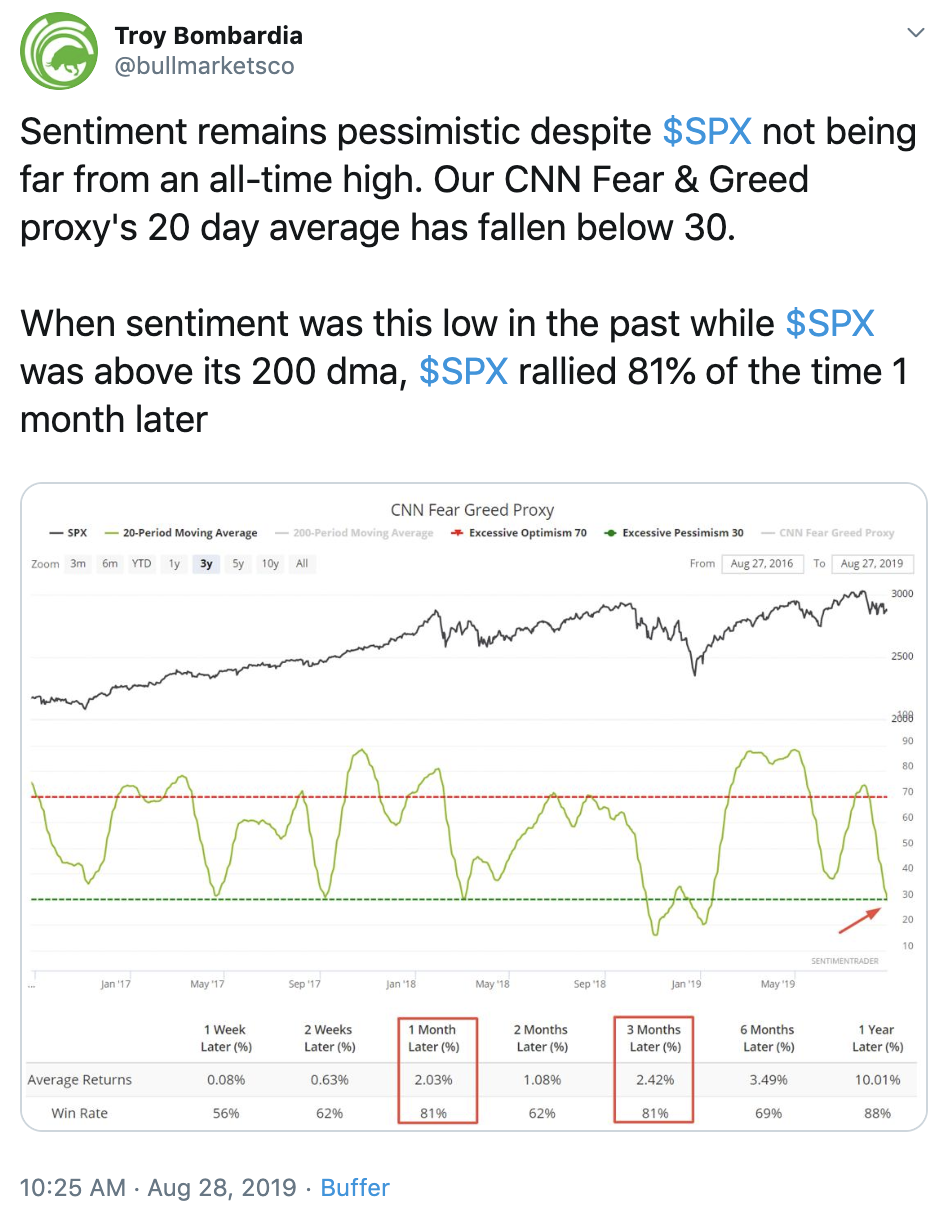
Today’s Chart of the Day was shared on Twitter by Troy Bombardia (@bullmarketsco). It’s a chart of the S&P 500 ($SPX) with a proprietary sentiment indicator below it. Troy points out that sentiment is excessively pessimistic even though the S&P 500 is above its 200-day moving average and less than 5% off of its all-time high. Sentiment tends to be a contrarian indicator, especially at extremes. Troy adds this great stat: “When sentiment was this low in the past while $SPX was above its 200dma, $SPX rallied 81% of the time one month later.” This chart reminds me of something that respected Technician, Walter Deemer once said: “The market will do whatever it has to do to embarrass the greatest number of people to the greatest extent possible.”
Quote of The Day
Top Links
The Tale of Two Retail ETFs – The Chart Report
In this week’s Chart of the Week column, we compare two different Retail ETFs, $XRT and $RTH. We explain why one of these ETFs is hitting new lows, while the other is hitting new highs, even though they both track the same industry group.
What’s Driven the S&P 500? – Bespoke
In this note from Bespoke, they break down which stocks have been the biggest contributors to the S&P 500’s gain so far this year, and which stocks have weighed on the index the most.
Stocks Range Bound Until the Fed Meets – Reuters
In this clip from Reuters, Mark Newton of Newton Advisors, and Fred Katayama discuss the possibility of the S&P 500 entering into a bear market.
Best and Worst Stocks After Labor Day – Schaeffer’s Investment Research
Schaeffer’s Investment Research examines the best and worst stocks to own the week after Labor Day, looking back 10 years.
Is This Still a Bull Market? – Real Vision
Chris Verrone of Strategas Research Partners made an appearance on Real Vision today. He addressed concerns over the inverted yield curve and explained why he’s still optimistic on the US stock market.
Top 10 Tweets
U.S. averages holding the Higher low weekly pattern through Wednesday while small caps hold a support level. Keeping things simple. pic.twitter.com/9H22lZ77QY
— Doug (@ScottsdaleDoug) August 28, 2019
Just in case you were wondering how $RUT $SPX and $NDX had done since the glitch was fixed. pic.twitter.com/vmxKaDY6ym
— OddStats (@OddStats) August 28, 2019
Does't really *look* like trouble ?https://t.co/GaQLpZktdp pic.twitter.com/VkjRVP7iPA
— SentimenTrader (@sentimentrader) August 28, 2019
Persistently high volatility in a tight range is often a recipe for a breakout. As such, I made an indicator looking at ATR relative to historical range, set it to 18 days and ran it for $SPX pic.twitter.com/CvOdN6vZDo
— John Kicklighter (@JohnKicklighter) August 28, 2019
Semiconductor relative strength once again teasing the 50-day moving average from above. A breakdown here would suggest further weakness and bearish sign for the overall equity markets. $SMH $SPY $SPX pic.twitter.com/V2pYOf6Wrn
— David Keller, CMT (@DKellerCMT) August 28, 2019
Yields on 30-year Treasuries have fallen below the 12-month dividend yield on the S&P 500 for the first time since 2009, as @theonedave pointed out to us this morning on @bloombergradio. This comes as 30-year yields fall to all-time lows of 1.93%. pic.twitter.com/0yb1GNNese
— Lisa Abramowicz (@lisaabramowicz1) August 28, 2019
Gold is posting new ATHs against most major global currencies $GC_F $GLD pic.twitter.com/GsG1aY2UKd
— Peter Brandt (@PeterLBrandt) August 28, 2019
I see a lot of love for #gold on twitter – and I am bullish long term – but entering here with Gold +$200 above its 200 day moving average is not a great risk-reward setup in my opinion. Steep negative divergence on the daily chart. Gold needs to cool off. $GC $GLD pic.twitter.com/nwb4ueZ8tS
— Tarek I. Saab (@FibLines) August 28, 2019
Bitcoin just dumped a quick 600 points over the last hour to go back below $10k – any "news"? pic.twitter.com/wC56U2O4pT
— Matt Weller CFA, CMT (@MWellerFX) August 28, 2019
Which asset class will have the best return in 2019?
— The Chart Report (@TheChartReport) August 28, 2019
You’re all caught up now. Thanks for reading!