Sponsored By:

Today’s Summary
Monday, August 30th, 2021
Indices: US Stocks were mixed to start the week. The Dow inched lower by 56 points or 0.16%. The S&P 500 and Nasdaq both closed at record highs, rising 0.43% and 0.90%, respectively. The Russell 2000 underperformed, slipping 0.49%.
Sectors: 7 of the 11 sectors closed higher. Real Estate led, gaining 1.22%. Financials lagged, falling 1.41%.
Commodities: Crude Oil futures moved higher by 0.68% to $69.21 per barrel. Gold futures fell 0.40% to $1,812 per ounce.
Currencies: The US Dollar Index was flat.
Interest Rates: The 10-year US Treasury yield fell to 1.282%.
Here are the best charts, articles, and ideas being shared on the web today!
Chart of the Day
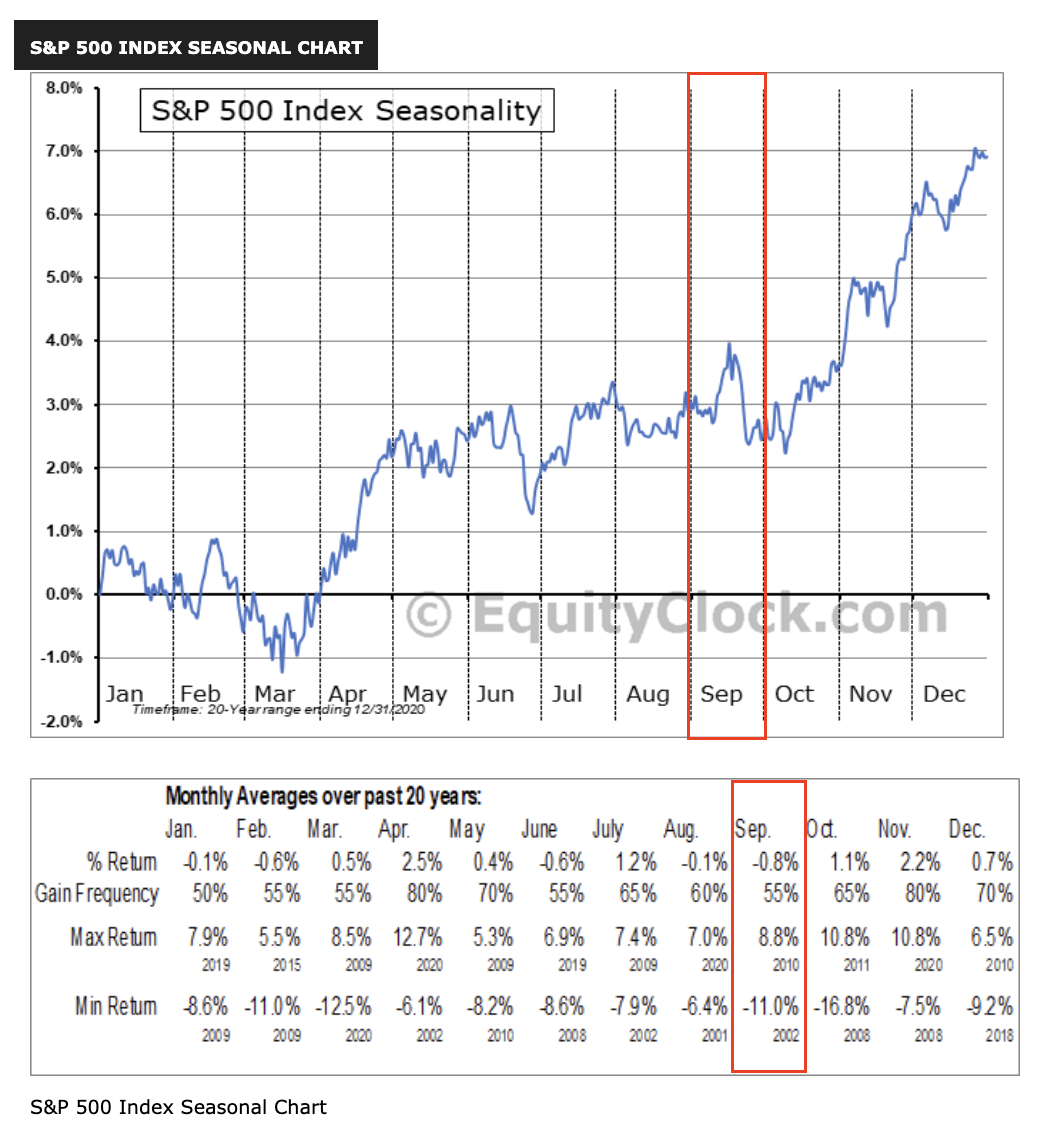
Today’s Chart of the Day comes from EquityClock.com (@EquityClock). It’s a seasonality chart showing the average performance of the S&P 500 throughout the year, using 20 years of data. September has historically been the worst month for the S&P 500, with an average loss of 0.80%. Assuming we don’t get some sort of epic sell-off tomorrow, the S&P 500 will likely close higher for the seventh straight month. As we start the new month, it’s important to keep this seasonal headwind in mind. Will it be enough to end the S&P 500’s monthly winning streak? To be fair, seasonality has been a headwind since May, and it hasn’t stopped the S&P 500 from rising nearly 8%. That sort of resilience is a testament to how strong the underlying trend is at the moment. It’s also important to consider that the calendar flips bullish for about six months after September (around mid-October). So, any potential weakness in September could prove to be a buying opportunity if history is any guide.
Quote of the Day
“An idiot with a plan can beat a genius without a plan.”
– Warren Buffett
Top Links
Three Reasons I’m a Little Less Bearish – StockCharts
David Keller highlights some bullish developments for the stock market.
What Type of Environment is This? – All Star Charts
JC Parets shares a few thoughts on the current market environment.
Good Day – The Weekly Trend
In this podcast, David Zarling and Ian McMillian discuss some of the most important technical developments they’re watching.
US Small Cap Equity Fund Flows: Capitulation – Top Down Charts
Mike Zaccardi takes a look at the recent reversal in Small-Cap stocks.
September’s First Trading Day Bullishness Waning – Almanac Trader
Seasonality expert, Jef Hirsch examines how stocks have historically performed on the first trading day of September.
Top Tweets
The S&P 500 is about to be up 7 months in a row.
What happens next?
6 months later higher 13 of 14 times, with an impressive 7.9% average return.
Might sound like a broken record the past 16 months, but yet another clue that continued strength is likely the path here. pic.twitter.com/IzTkpDc4Xv
— Ryan Detrick, CMT (@RyanDetrick) August 30, 2021
There is a lot of pent up energy in $IWM this is a great example of a "correction thru time" as it waited for the 200DMA to catch up to it rather than drop down to test it.
chart from @MarketSmith pic.twitter.com/U3T1KB9bI6
— Brian Shannon, CMT (@alphatrends) August 29, 2021
Where does "Small-Cap Growth breaking out from 7 months of consolidation" fit with your view of the current market? $IJT ? pic.twitter.com/OJ4WnHZeK1
— Grayson Roze (@GraysonRoze) August 30, 2021
Equal-weight $SPX is up 24% this year and nearly 50% in the past 2 years. It has made a new ATH every month in the past year. The average stock is doing just fine pic.twitter.com/Rfhh69Nx15
— Urban Carmel (@ukarlewitz) August 29, 2021
Impressive rebound in short-term breadth for S&P 500 Financials … sector now has 95% of members trading above their 50d moving average (up from just 14% in mid-July) pic.twitter.com/vT110b00cQ
— Liz Ann Sonders (@LizAnnSonders) August 30, 2021
High yield bonds $HYG confirming upside potential with break above July highs. Feels like one by one, the bearish non-confirmations are becoming bullish confirmations… pic.twitter.com/FXb1Ftbh3h
— David Keller, CMT (@DKellerCMT) August 30, 2021
the high yield spreads had ticked up (ever so slightly) but last week that's a clear tick back downwards – continuing to paint an unconcerned picture by risk-takers in the credit markets… pic.twitter.com/7mPiIIc9pb
— David Cox, CMT, CFA (@DavidCoxWG) August 30, 2021
No upside follow through for the Dollar Index last week. False breakout? pic.twitter.com/6Sep3VCphg
— Dan Russo, CMT (@DanRusso_CMT) August 30, 2021
Lots of bearish candlesticks for the USD last week. It will be interesting to see how the dollar fares heading into the end of the month. $USDNOK pic.twitter.com/UztdnxlURB
— Ian Culley (@IanCulley) August 30, 2021
So far this year, the S&P 500 has gained 14.9% on the first five trading days of the month.
It's gained 4.5% during the rest of the month.
— Eddy Elfenbein (@EddyElfenbein) August 30, 2021
You’re all caught up now. Thanks for reading!