Daily Chart Report 📈 Friday, September 20, 2024
Powered By:

Today’s Summary
Friday, September 20, 2024
Indices: Dow +0.09% | S&P 500 -0.19% | Nasdaq -0.24% | Russell -1.10%
Sectors: 2 of the 11 sectors closed higher. Utilities led by a wide margin, gaining +2.64%. Materials lagged, falling -0.71%.
Commodities: Crude Oil futures fell -0.22% to $71.00 per barrel. Gold futures gained +1.21% to an all-time high of $2,646 per oz.
Currencies: The US Dollar Index rose +0.10% to $100.74.
Crypto: Bitcoin is currently up +0.25% to $63,101. Ethereum is up +3.30% to $2,546.
Volatility: The Volatility Index fell -1.10% to 16.16.
Interest Rates: The US 10-year Treasury yield rose to 3.741%.
Here are the best charts, articles, and ideas shared on the web today!

This Chart Report is sponsored by REX Shares. REX gives investors easy access to ETFs that offer 2x long and short exposure to your favorite tech stocks, including Bitcoin! Check them out to learn more.
Chart of the Day
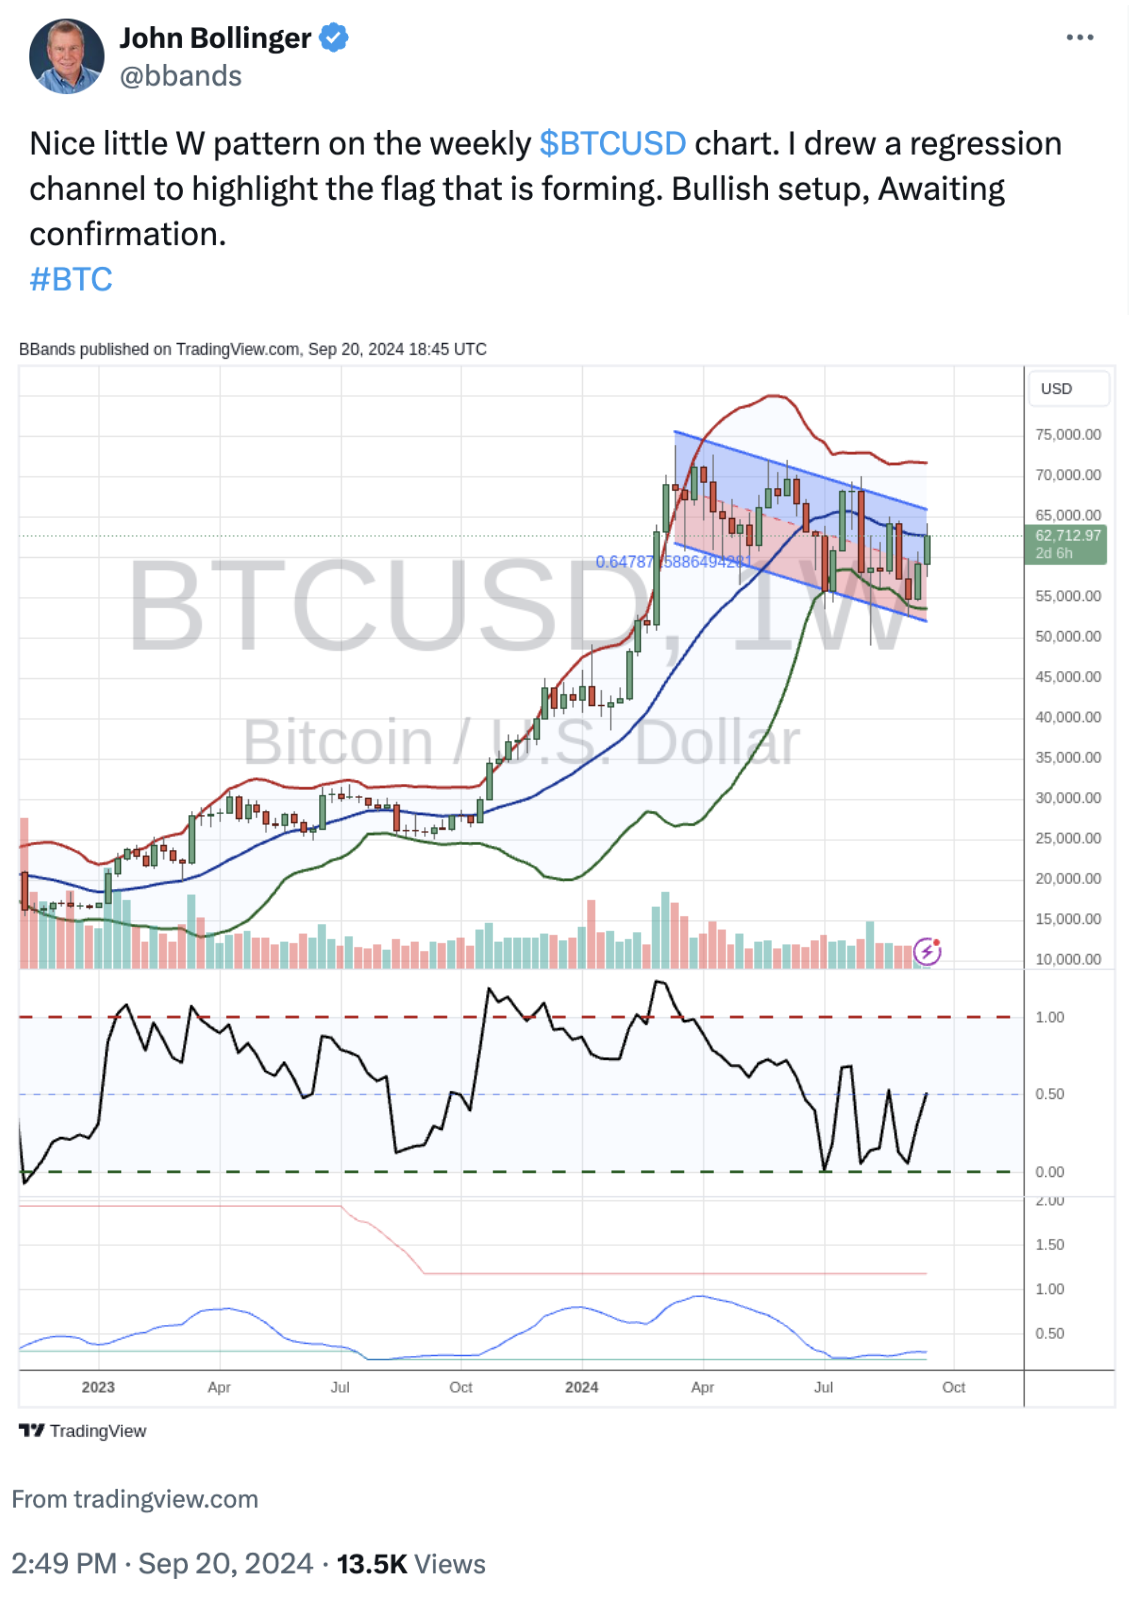
🏆 Today's Chart of the Day was shared by John Bollinger (@bbands).
- Bitcoin has been in a falling channel since the breakout failed in March. However, that falling channel is beginning to look like one giant Bull Flag within a longer-term uptrend.
- John points out that Bitcoin has formed a W Bottom within this bull flag. John popularized this bullish reversal pattern, which incorporates his famous Bollinger Bands. It will be confirmed on a weekly close above the middle band (around $63k).
- The pattern requires:
1.) A close below the lower band
2.) A bounce to the middle band
3.) A lower low that does not close outside the lower band.
Takeaway: Bitcoin has formed a bullish reversal pattern within a downtrend, and the downtrend looks like a bullish continuation pattern within a longer-term uptrend.
Quote of the Day
“I can’t change the direction of the wind, but I can adjust my sails to always reach my destination.”
– Jimmy Dean
Top Links
A Sector Rotation Dilema ... - StockCharts
Julius de Kempenaer analyzes recent sector rotation.
Utilities Reacting to Reactor News - Bespoke
Bespoke examines the Utilities sector after its recent run.
S&P Mid-Caps Hit All-time Highs - All Star Charts
JC Parets looks at the Mid-Cap S&P 400 index.
Gold Continues to Shine - LPL Financial Research
Adam Turnquist highlights the rally in Gold.
Top Tweets
You’re all caught up now. Thanks for reading!