Sponsored By:

Today’s Summary
Wednesday, October 2nd, 2019
Indices: US stocks closed lower in today’s session with the Dow Jones Industrial Average dropping 494 points or 1.86%. The S&P 500 and Nasdaq were lower by 1.79% and 1.56%, respectively. The Russell 2000 outperformed the rest of the major indices but still slid 0.92%.
Sectors: All 11 sectors fell for the second day in a row. Real Estate led but ended down 0.62%. Energy lagged, falling 2.46%
Commodities: Crude Oil futures moved lower by 1.79% to $52.64 per barrel. Gold futures gained 1.13% to $1,508 per ounce.
Currencies: The US Dollar Index slipped 0.10%.
Interest Rates: The US 10-year Treasury yield dropped to 1.601%.
Here are the best charts, articles, and ideas being shared on the web today!
Chart of the Day
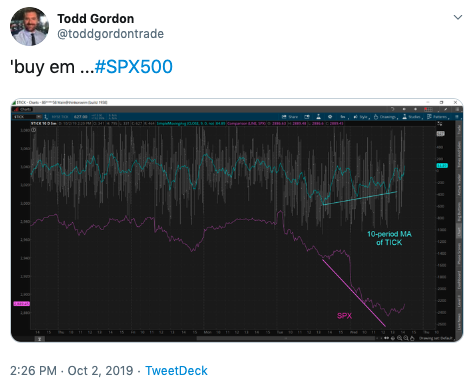
Today’s Chart of the Day was shared on Twitter by Todd Gordon (@toddgordontrade). It’s a chart of the NYSE Tick Index ($TICK) with a 10-period moving average in blue. In purple is the S&P 500. The Tick Index is a short-term indicator often used by day traders. It measures the number of stocks in the NYSE on an uptick, minus the number of stocks on a downtick. In another tweet, Todd adds: “Sub -600 readings and lower indicate institutional sell programs. If those damn machines are hitting bids the selling abates.” You can see that the tick index made three higher-lows while the S&P 500 made three lower-lows. Sure enough, this divergence was followed by a small relief rally in the afternoon.
Quote of The Day
Top Links
Broad Market Breadth | Jonathan Krinsky – StockCharts.com
In this video, Jonathan Krinsky of Baycrest Partners and David Keller discuss market breadth, software, and the “trains vs. planes” trade.
Three Charts That Tell The Risk Story – All Star Charts
JC Parets of All Star Charts lays out three important charts to keep an eye on right now.
Third-Quarter Market Recap: A Mixed Bag of Results – Bloomberg
Bloomberg’s Abigail Doolittle highlights some of the key takeaways from Q3 and what to watch for going into Q4.
Another Investor Sentiment Red Flag Goes Up – Schaeffer’s Investment Research
Bernie Schaeffer examines the spread between bulls and bears from the latest Investors Intelligence sentiment survey.
Is October Really Scarry? – LPL Financial Research
Here’s an insightful note from the team at LPL Financial Research that examines October seasonality.
Top 10 Tweets
Stocks plunge to levels that keep it on track for the best year since 1997.
— Morgan Housel (@morganhousel) October 2, 2019
On average the market falls 5% three times a year. We've had 2 of these so far. Will this be the 3rd? Literally no one knows.
You may not like it but that's what history shows. pic.twitter.com/dhnO7Q5Qlw
— Michael Antonelli (@BullandBaird) October 2, 2019
While the S&P500 and major indexes are sliding nearly 2% today, growth stocks are outpacing value stocks today and over the last week contrary to the trend we saw in August that spooked so many while stocks held firm. Plenty of pundits will be scratching their heads! $SPX pic.twitter.com/mfFp5KUfFe
— Michael McKerr (@MikeMcKerr_TDA) October 2, 2019
$SPY finding support at the VWAP from the lows from the late January consolidation period, which served as support later on in Feb, March, and May. Also eyeing VWAP from the 1/3 lows, which served at support for the recent consolidation period we saw in August. pic.twitter.com/wlFafidziS
— Ian McMillan, CMT (@the_chart_life) October 2, 2019
#Russell2000 -7% downside target in the coming weeks ?#IWM #RTY pic.twitter.com/s6O08k8UuT
— Momentum is Golden (CMT) (@supercatmy) October 2, 2019
Technology SPDR $XLK Breaking Post-2018 Up Trendline
#TrendlineWednesday pic.twitter.com/NPorZFtwQA— Dana Lyons (@JLyonsFundMgmt) October 2, 2019
Interesting to note that on a relative basis the online brokers had been underperforming the $SPY for a while. Highlights the importance of relative strength and staying focused on the market leaders. $ETFC $AMTD $SCHW pic.twitter.com/ThoJszf7zB
— Dan Russo, CMT (@DanRusso_CMT) October 2, 2019
initial volume node for GC pic.twitter.com/lUaZM1DAEn
— Linda Raschke (@LindaRaschke) October 2, 2019
Resiliency of copper as it tested support yesterday was encouraging. If not making new highs is seen as not being bullish, than not making new lows can be seen as not bearish. pic.twitter.com/xAfpraE7JV
— Willie Delwiche (@WillieDelwiche) October 2, 2019
Another all-time closing high for Palladium…or as we like to call it, Wednesday.
— Tom Bruni, CMT (@BruniCharting) October 2, 2019
Upcoming Events
Thursday, October 3rd – CMT Association New York Chapter Meeting Featuring Todd Sohn, CMT
Thursday, October 3rd – Atlanta Chapter Meeting Featuring Katie Stockton, CMT
Sunday, October 6th – A Look At The Markets Into Next Week Using TrendSpider w/ Guest Patrick Dunuwila from “The Chart Report”
Wednesday, October 9th – Webcast: “The Market Between Now And Year-End” with Ralph Acampora, CMT
You’re all caught up now. Thanks for reading!