Sponsored By:

Today’s Summary
Wednesday, December 9th, 2020
Indices: US Stocks closed lower in today’s session with the Dow Jones Industrial Average slipping 105 points or 0.35%. The S&P 500 and Nasdaq dropped 0.79% and 1.94%, respectively. The Russell 2000 fell 0.82%.
Sectors: 3 of the 11 sectors closed higher. Energy and Industrials led, with both inching up 0.22%. Technology lagged, falling 1.92%.
Commodities: Crude Oil futures inched lower by 0.18% to $45.52 per barrel. Gold futures dropped 1.94% to $1,839 per ounce.
Currencies: The US Dollar Index rose 0.13%.
Interest Rates: The 10-year US Treasury yield inched higher to 0.933%.
Here are the best charts, articles, and ideas being shared on the web today!
Chart of the Day
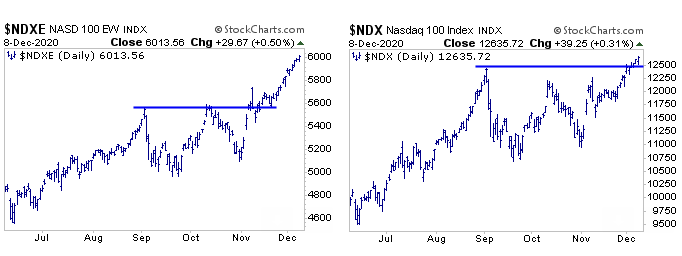
Today’s Chart of the Day was shared in a note by Frank Cappelleri of Instinet (@FrankCappelleri). On the left is the Nasdaq 100 equal weight index over the past six months, and on the right is the Nasdaq 100 over the same period. The Nasdaq 100 is heavily weighted towards a handful of Mega-Cap names. The top 5 stocks within the Nasdaq ($AAPL, $MSFT, $AMZN, $TSLA, and $FB) represent a whopping 40% of the index. As we know Mega-Caps have lagged recently and only one of those five stocks is currently trading above its September high ($TSLA). Frank points out that the equal weight Nasdaq 100 broke out over a month ago while the Nasdaq broke out just last week. In the note, Frank explained, “While that connotes that a greater amount of names now are stretched, it also shows how strong the participation has been.” Broad participation is certainly constructive. But now that we’ve gotten that, Mega-Cap heavyweights will need to wake up in order to propel this breakout higher.
Quote of the Day
“Whenever you find the key to the market, they change the locks.”
– Lucien Hooper
Top Links
Uptrends, Uptrends Everywhere – SentimenTrader
Jason Goepfert takes a look at what has historically happened when nearly all stocks in the S&P 500 are above their 200-day moving average.
Energy Stocks Sending First Bullish Message in Over a Decade? – Kimble Charting Solutions
Chris Kimble breaks down a long-term ratio chart of the Energy Sector vs. the S&P 500.
Stock Market Analysis December 9 2020 – Brian Shannon
After today’s mild sell-off, Brian Shannon lays out some key levels to watch in the near-term.
This is What Overwhelming Supply Looks Like – All Star Charts
JC Parets gives an update on Bitcoin as it struggles to extend above its former highs.
Dan, Why Semiconductors? – Marea Market Musings
Here’s a good read from Dan Russo about Semiconductors and why they’re such an important indicator.
Top Tweets
US equities are extending their slide. The Nasdaq 100 is currently suffering its biggest single day drop since Oct 30. Keeping an eye on 12,200 pic.twitter.com/40qW3ktf08
— John Kicklighter (@JohnKicklighter) December 9, 2020
There are a lot of amazing stats from this year, rank this one right up there.
Small caps are currently up more than the S&P 500. Wow. pic.twitter.com/hUrPUcjvSW
— Ryan Detrick, CMT (@RyanDetrick) December 9, 2020
I thought this would be a logical place for Small-Caps to digest their gains but I guess buyers have other plans $IWM $SPY pic.twitter.com/RtLEdMInCA
— Louis Sykes (@haumicharts) December 9, 2020
It’s not rotation out of tech. It’s rotation out of mega-cap. In fact small-cap tech and mid-cap tech have been going parabolic, which is the opposite of “rotation out”. Here’s what micros look like vs megas h/t @granthawkridge megas crushed relative pic.twitter.com/VXOad9l1aE
— J.C. Parets (@allstarcharts) December 9, 2020
How often do you see this? Stock benchmarks hit records yet all FAANG stocks except $GOOGL haven’t taken out early September highs pic.twitter.com/g7qB0uGR9k
— Sarah Ponczek (@SarahPonczek) December 9, 2020
2020 $SPX rally is quite similar in degree to what was seen off of the 2009 lows. Then, as now, the rally produced a shift from excessive pessimism to excessive optimism. The rally in 2010 stalled until optimism faded and investors turned more cautious. pic.twitter.com/uF8TNUA1bw
— Willie Delwiche, CMT, CFA (@WillieDelwiche) December 9, 2020
One of the risk factors I've been looking at globally and at the individual sector level is the failure of RSI to reach overbought territory. And the ones that did showing a negative divergence.
They lacked confirmation, but a multi-day selloff would confirm most of them. pic.twitter.com/uK87mxDuuu
— Tom Bruni, CMT (@BruniCharting) December 9, 2020
This is a chart of #copper relative to #gold. Since Aug, copper has dramatically outperformed gold, but now pushing into multi-year resistance at extremely overbought levels. How price reacts here bears watching closely as an indicator for the macro landscape. $GLD $COPX pic.twitter.com/3oKvAo0bDH
— Tarek I. Saab (@FibLines) December 9, 2020
Critical level for Bitcoin. Yes the adoption of DLT is massive, but yes the Bitcoin price can also retrace lower. Price is not a one-way certainty. pic.twitter.com/xZORnNLLMO
— James Brodie CMT (@jamesrbrodie) December 9, 2020
Virgin Galactic is +100% since the end of October…is it rising on hopes of people wanting to leave earth? https://t.co/9f9EzsvVVi
— Hipster (@Hipster_Trader) December 9, 2020