Sponsored By:

Today’s Summary
Wednesday, December 18th, 2019
Indices: US stocks were little changed in today’s session with the Dow Jones Industrial Average slipping 28 points or 0.10%. The S&P 500 changed just 0.04% while the Nasdaq changed 0.05%. The Russell 2000 was the strongest of the major indices, inching up 0.25%.
Sectors: Real Estate led, gaining 1.41%. Industrials and Financials lagged, both falling 0.42%.
Commodities: Crude Oil futures were flat and continue to trade at $60.85 per barrel. Gold futures slipped 0.13% to $1,479 per ounce.
Currencies: The US Dollar Index rose 0.19%.
Interest Rates: The US 10-year Treasury yield moved higher to 1.922%.
Here are the best charts, articles, and ideas being shared on the web today!
Chart of the Day
$TLT long-bond ETF is just breaking its 2019 uptrend WITH relative performance vs the $SPX giving up 6-months of performance breaking below the July lows. Relative performance often (not always) leads price with TLT 134 support looking vulnerable. pic.twitter.com/Ie5Q9MzWxt
— Robert Sluymer (@rsluymer) December 18, 2019
Today’s Chart of the Day was shared on Twitter by Robert Sluymer (@rsluymer). It’s a daily bar chart of the 20+ year Treasury Bond ETF, $TLT. The orange line below shows $TLT relative to the S&P 500 ($SPX). The impressive rally that Bonds had in 2019 looks like it’s coming to an end. Robert points out that $TLT is breaking down on both an absolute and relative basis. On an absolute basis, price broke below its uptrend line and is coming out of a tight coiling pattern. On a relative basis, $TLT/$SPX is breaking below the July lows. Robert explains that relative performance often leads price, which suggests Bonds are likely to experience further weakness.
Quote of the Day
“If you don’t know who you are, the stock market is an expensive place to find out.”
Top Links
Last Time This Happened… – Ciovacco Capital Management
Chris Ciovacco lays out why the latest Bank of America Fund Managers Survey suggests we’re in a bullish environment.
Midweek Stock Market Price Action Recap 12-17-19 -The Trade Risk
In this video, Evan Medeiros analyzes the technicals of the major averages and sectors of the market.
S&P 1500 Best Stocks of the Decade – Bespoke
Bespoke highlights the best-performing stocks within the S&P 1500 over the past ten years.
2019 Market Strength Could Give Election-Year 2020 a Boost – Almanac Trader
2019 has been an above-average year for stock market returns, raising concerns that 2020’s gains have been pulled forward. Jeff Hirsch explains why the market could still be strong next year despite this year’s impressive performance.
Focus on Financials – StockCharts.com
Julius de Kempenaer uses Relative Rotation Graphs to identify some of the strongest stocks within the Financial sector.
Top 10 Tweets
You might hear how stocks are up a lot and this means next year will be bad.
Not necessarily.
S&P 500 could be up >30% (total return) in 2019. Historically, the following year has been higher 10 of 12 times and the avg. return is 15.2%. pic.twitter.com/1dhDGVxPlI
— Ryan Detrick, CMT (@RyanDetrick) December 18, 2019
In the grand scheme of things, 2019 has been a great year for the $SPX historically. But it isn't a record, or even 2nd / 3rd place in terms of the best returns since the 50s: pic.twitter.com/jFyXGGp7O3
— OmahaCharts, CMT (@omahacharts) December 18, 2019
Take a look at this: #Market breadth is improving as indicated by the expansion in new 12-month highs. This indicates that the market rally is becoming more broad based. pic.twitter.com/AoQU3yLrcT
— Jurrien Timmer (@TimmerFidelity) December 18, 2019
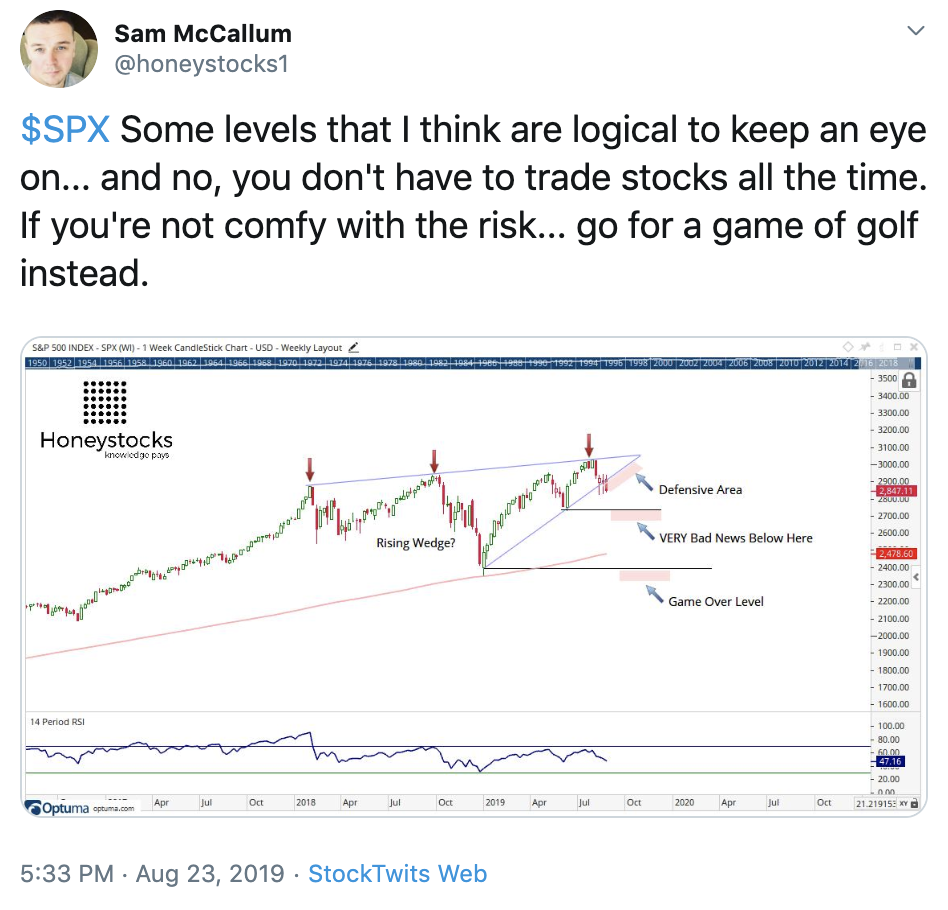
$SPX $SPY … what are we thinking here? Clearly a bull market but I think it's good to ask the question "what if.".. just a consideration and any return to the mean would likely represent opportunity… the chart just says… be careful. pic.twitter.com/gOjjid4Ado
— Sam McCallum (@honeystocks1) December 17, 2019
We believe S&P "targets" are silly, so we use sparingly (for conviction). This Fall our work suggested 3200 by year's end, and here we are. P/C is starting to gnaw at us regarding the enthusiasm for stocks…probably not an issue until 2020, but forewarned. pic.twitter.com/HINHp76HMp
— RenMac: Renaissance Macro Research (@RenMacLLC) December 18, 2019
Mutual funds might not be cool anymore, but Rydex still holds more than $4 billion.
Of that, less than 11% is being held in their money market, the lowest in history. A few dates saw *almost* this low of a cash cushion. pic.twitter.com/h1ekyqQkKt
— SentimenTrader (@sentimentrader) December 18, 2019
In recent decades, cyclical bottoms in long-term UST yield have tended to lag $SPX, perhaps due to repressive CB policy. August 2019 looks & feels like an important bond-market inflection, suggesting a move toward 2.50% yield or higher on 10s. (Working hypothesis.) $TNX $TLT pic.twitter.com/xjUg7z5hdd
— Mark Ungewitter (@mark_ungewitter) December 18, 2019
$EEM #EmergingMarkets Emerging Markets Breaking Out ??? pic.twitter.com/Kkl1YNFwHe
— Nautilus Research (@NautilusCap) December 18, 2019
In 1964 (great year, you can guess why), top 5 stocks accounted for > 27% of index; % fell steadily into early-90s, bottoming near 10%; over past few years, biggest stocks have grown relative to rest of index & now account for ~18% of S&P’s market cap @biancoresearch pic.twitter.com/5FwlZLiS4Z
— Liz Ann Sonders (@LizAnnSonders) December 18, 2019
Tesla at a new all-time high for the first time since September 2017, up 2,199% from its IPO in June 2010. $TSLA pic.twitter.com/6KiYNm6Ndd
— Charlie Bilello (@charliebilello) December 18, 2019
You’re all caught up now. Thanks for reading!
$TLT long-bond ETF is just breaking its 2019 uptrend WITH relative performance vs the $SPX giving up 6-months of performance breaking below the July lows. Relative performance often (not always) leads price with TLT 134 support looking vulnerable. pic.twitter.com/Ie5Q9MzWxt
— Robert Sluymer (@rsluymer) December 18, 2019