Has the Rally in Gold Come to an End?
Gold began 2019 on a strong note, but in the past two weeks, it has given up virtually all of its gains. In mid-February, it was up 5% year-to-date, to peak out around $1,350 an ounce but is now trading around the same price it began the year at around $1,288. Only a few weeks ago, Gold bugs were calling for $1,500-$1,600 per ounce by years end but, those voices have been silenced by the sharp drop recently. Many technicians have turned bearish on the precious metal as it seems to have failed to break out of a key long-term resistance level.
Tom Bowley, of StockCharts.com, wrote a great piece this past weekend, titled: The Gold Rush is Likely Over. In the article, Tom discusses why the U.S. Dollar is suggesting that Gold is headed lower. He explains that historically, Gold and the U.S. Dollar have had an inverse relationship and uses the phrase "Gold thrives when the dollar dives." He includes the charts below from 2001-2011 to support his point.

Tom points out that since 2011, the U.S. Dollar has been in a long-term uptrend. He expects this uptrend to continue, which will likely put pressure on Gold. He also found that the direction of the Dollar is often signaled by the relationship between foreign and domestic Treasury yields. Tom's research has found that the spread between the U.S. 10-year Treasury yield and the German 10-year Treasury yield serves as a great signal for the direction of the U.S. Dollar. When U.S. yields are outperforming German yields, it's a sign our economy is growing at a faster rate, which would support a stronger Dollar. Below is the chart he included in the article to show this relationship.

Below is a tweet from another technician, Arun Chopra, emphasizing the impact the U.S. Dollar has on Gold.
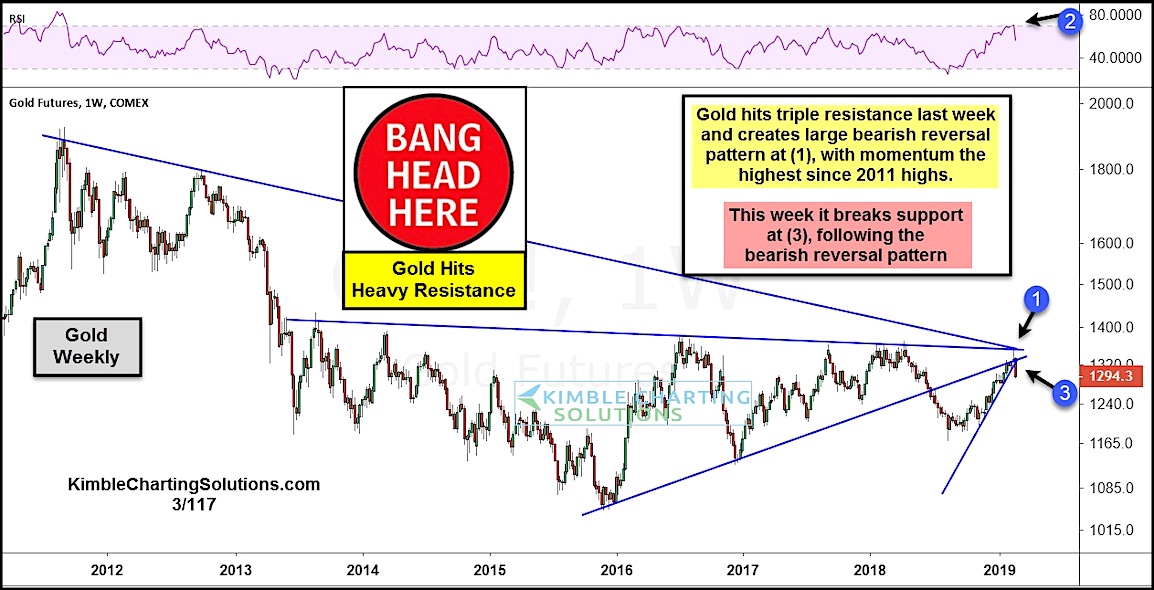
Respected chart-watcher, Chris Kimble, recently turned bearish on Gold as well. In a short blog post out this morning, Kimble explains why he thinks the 6-month rally into February is over. He uses this weekly chart of Gold futures to illustrate how the precious metal failed to break out of an important resistance level while at the same time momentum was overheating. In addition, Kimble points to the bearish reversal candle that has formed in the weekly chart as a reason to stay away from Gold right now.
If you ask any Gold bug, they'll give you a dozen reasons why Gold will be higher by years end. However, recent price action has many technicians warning that Gold is more likely to head lower from here. We'll continue to keep an eye on it and report back with any major developments.