The Three Major Developments Today
What a day! The S&P 500 hit a record high, Gold prices hit their highest level in over five years, and the US 10-year Treasury Yield fell below 2%. Three major developments in the financial markets, across three major asset classes (Stocks, Commodities, and Interest Rates). Let's take a look at what some of the smartest analysts are saying about these important milestones.
S&P 500 New All-Time High
Below is a chart that was shared this morning, in a research note by Frank Cappelleri of Instinet. In the note, Frank discusses the fresh all-time high in the S&P 500 index. He notes that the index is back at the 2,950 level after rallying about 8% in three weeks, from the June 3rd low. He explains that the S&P 500 has been around this level several times in the past year adds that this time it "must do a better job of extending beyond this zone than prior attempts."
With today's the new all-time high, RSI is now in overbought territory. This begs the question; is this rally extended here or can we continue higher? Frank points out a key difference between this attempt and previous attempts to breakout at this level. He explains: "The difference is that the previous attempts up here were preceded by multiple MONTHS of stretched RSI readings." His chart below demonstrates the ability for RSI to remain in a bullish range for weeks/months without price breaking down.

Gold Prices Hit a Five-year High
Gold futures surged in the extended trading session last night, pushing it to its highest level since 2013. The yellow metal gapped above a long-term resistance level to open nearly 3% higher at $1,388.80 per ounce. It's up over 8% year-to-date and on track to have its best day in over two years. Silver and the mining stocks are also rallying along with Gold. Can precious metals continue higher from here?
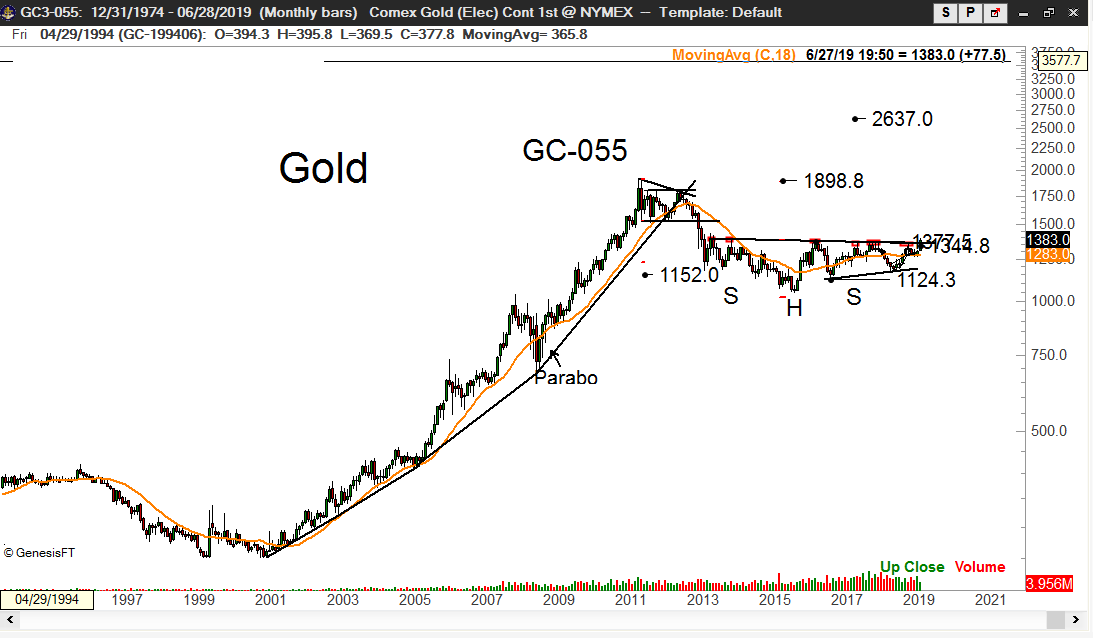
The legendary trader and chartist, Peter Brandt weighed in by sharing this chart below on Twitter. It's a monthly chart of Gold futures going all the way back to 1994. In the Tweet, Peter commented: "Gold is attempting to complete a massive multi-year inverted H&S pattern. This pattern, if successfully completed, has targets as high as 2637."
US 10-year Treasury Yield Falls Below 2%
US Treasury Yields took a nose dive after the Fed announced their decision to leave rates unchanged yesterday. The US 10-year Treasury yield fell below 2%, to the lowest level since 2016. Below is a tweet from Jim Bianco of Bianco Research that shows that the last time the 10-year yield was below 2% was the day before election night in 2016. If you remember, the day after election day was the start of a steady rally in stocks, that lasted over a year. The 10-year Treasury yield continued to rally off that 2% low until peaking out in November of last year. It'll be interesting to see if the 2% level will act as support for the 10-year yield and to see if the market.