Daily Chart Report 📈 Wednesday, May 31, 2023

Powered By:

Today’s Summary
Wednesday, May 31, 2023
Indices: Dow -0.41% | S&P 500 -0.61% | Nasdaq -0.71% | Russell 2000 -1.00%
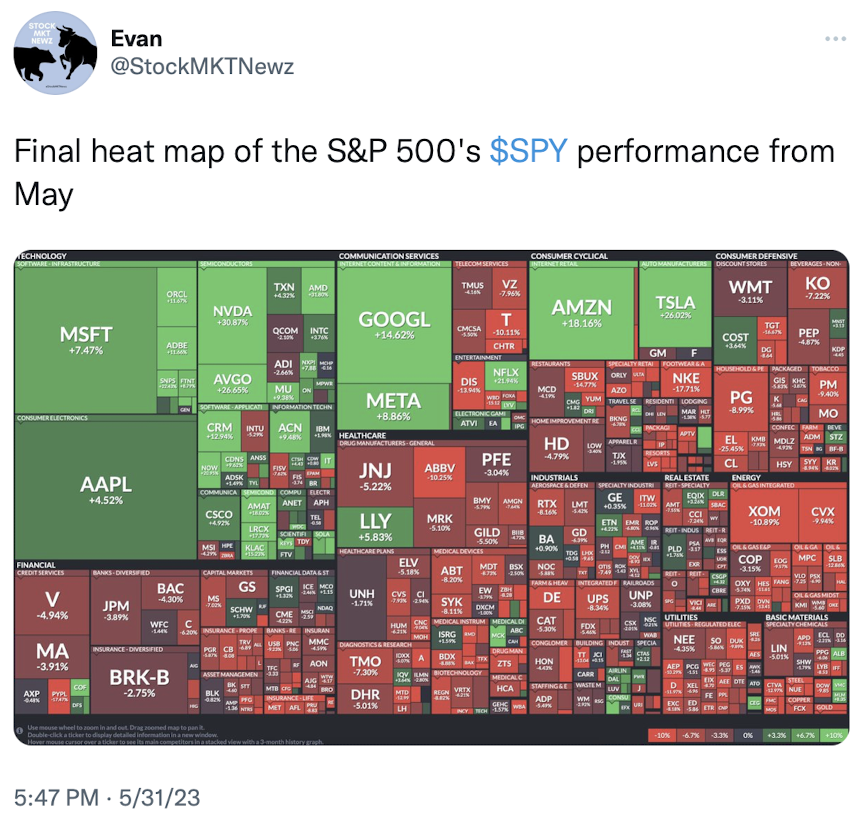
Sectors: 5 of the 11 sectors closed higher. Utilities led, rising +0.92%. Energy lagged, dropping -1.76%.
Commodities: Crude Oil futures dropped -1.97% to $68.09 per barrel. Gold futures rose +0.25% to $1,982 per oz.
Currencies: The US Dollar Index gained +0.17% to $104.06.
Crypto: Bitcoin dropped -2.00% to $27,160. Ethereum fell -1.75% to $1,868.
Interest Rates: The US 10-year Treasury yield fell to 3.646%.
Here are the best charts, articles, and ideas being shared on the web today!
Chart of the Day
Friendly reminder:
We're breaking out on the monthly chart. pic.twitter.com/n2eqbfBXrY
— Jake Wujastyk (@Jake__Wujastyk) May 31, 2023
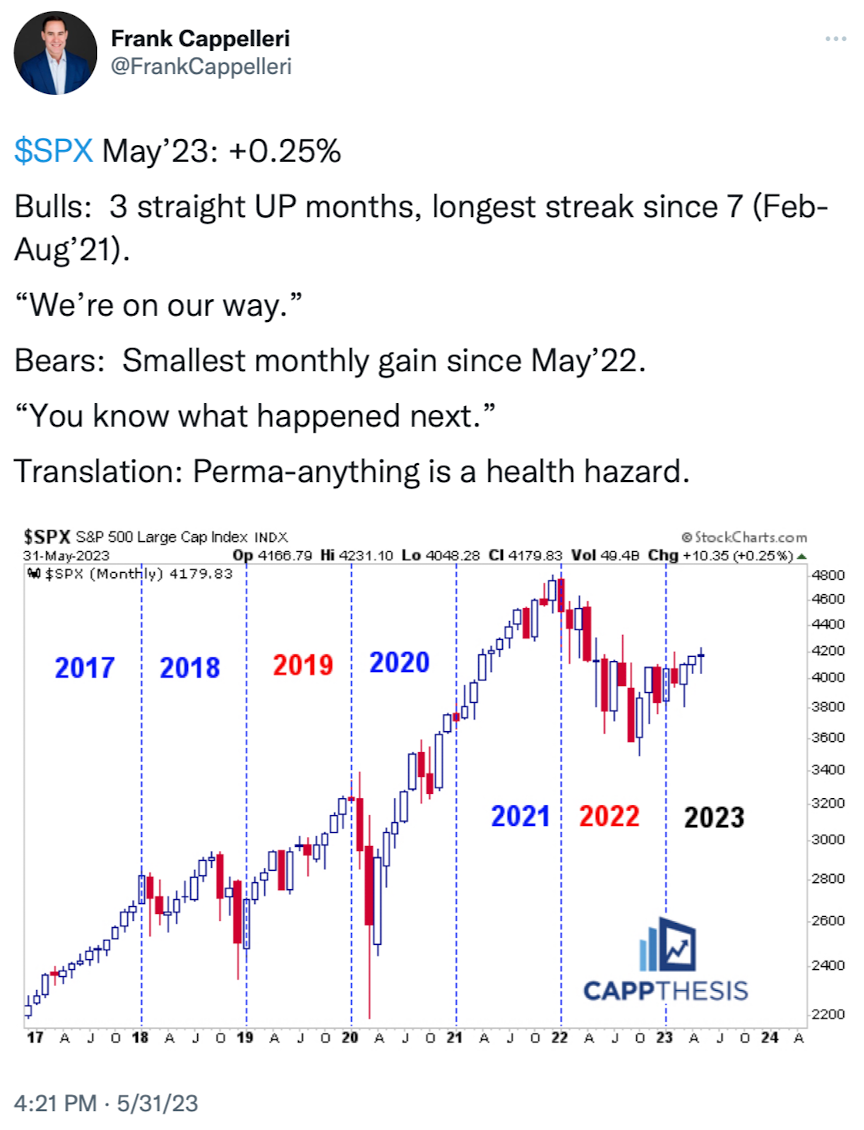
Today’s Chart of the Day was shared by Jake Wujastyk (@Jake_Wujastk). May is in the books! The S&P 500 inched higher by just +0.25% this month, but that was enough to mark a new 14-month high. Jake reminds us that the S&P 500 is continuing to breakout of a one-year base on the monthly chart. It broke out to 12-month highs last month for the time in a year, which has historically been followed by above average returns. Also, the MACD (lower panel) is curling higher and setting the stage for a bullish crossover in the coming months. Day-to-day price action can be disorienting. When you zoom out, the breakout remains fully in-tact and perhaps in its early stages.
Quote of the Day
“People only see what they're prepared to see.”
– Ralph Waldo Emerson
Top Links
Something for Everyone - Trading Adventures
Andy Moss reviews price action so far this week.
DJIA Up Nine of Last Ten Years on June's First Trading Day - Almanac Trader
Jeff Hirsch examines how the major indices have historically performed on the first trading day in June.
Time for a June Swoon - LPL Financial Research
Adam Turnquist looks at June seasonality for the S&P 500 and some key levels to watch next month.
Pesky Breadth Divergence Persists - StockCharts.com
Arthur Hill points out that breadth continues to deteriorate.
What if We Get Rotation? - All Star Charts
JC Parets looks at what healthy rotation would look like.
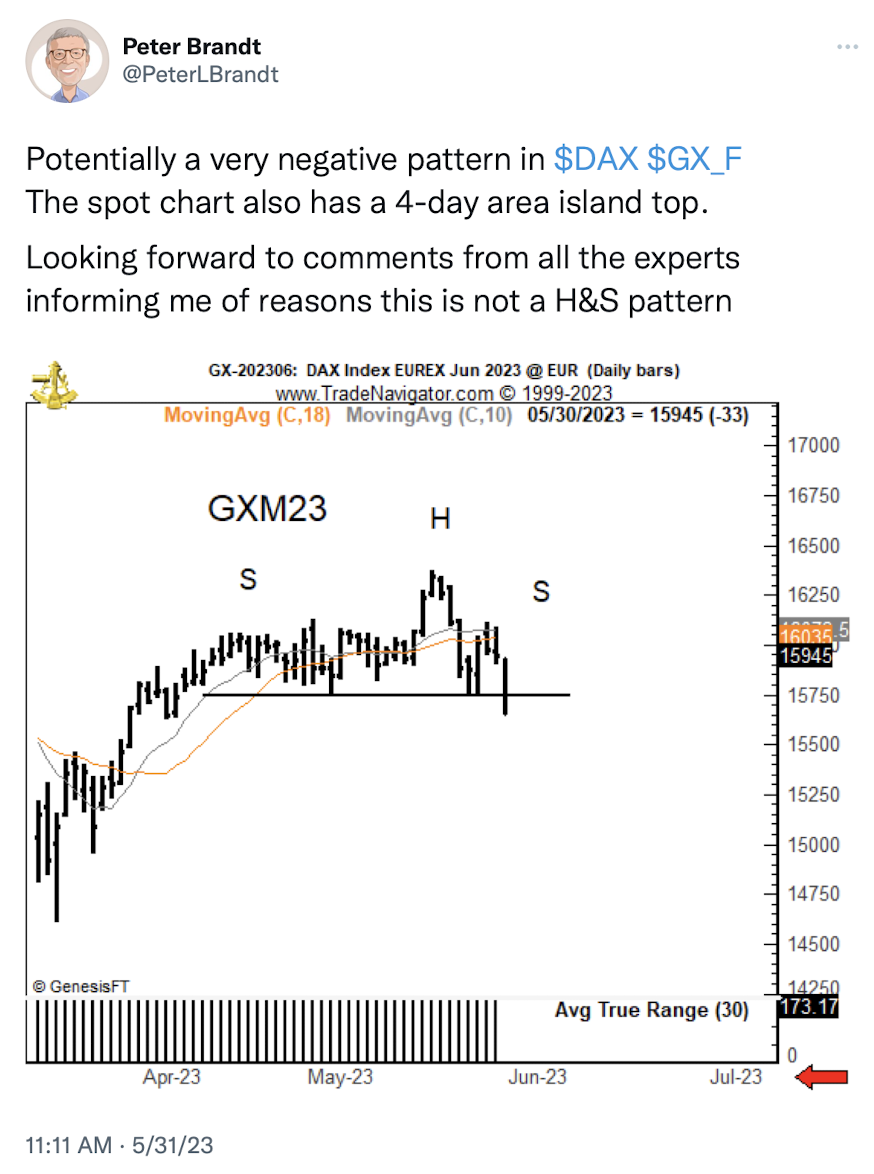
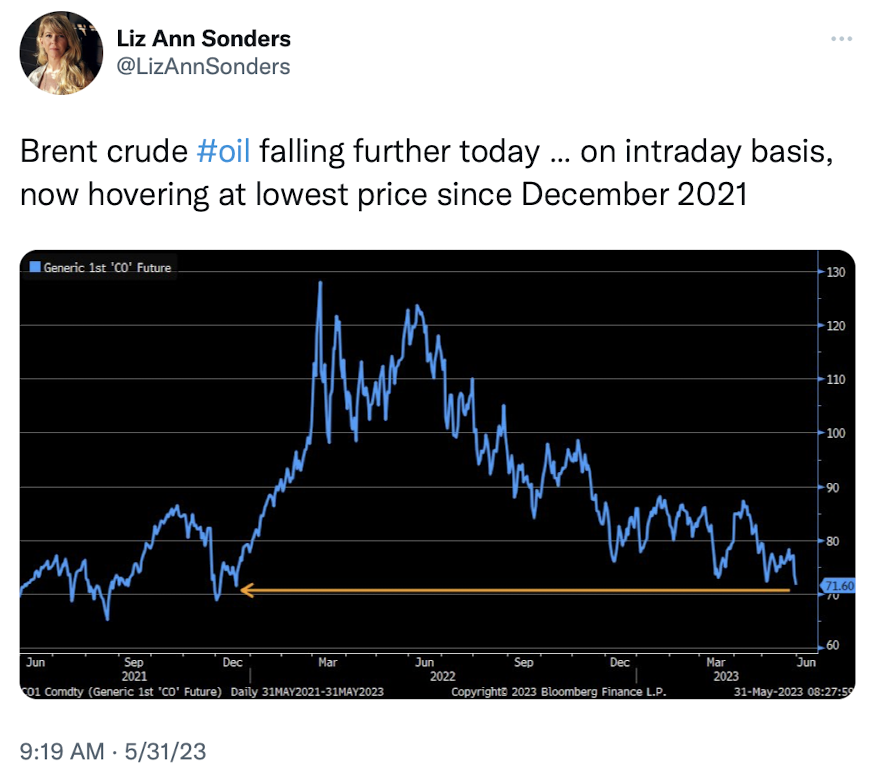
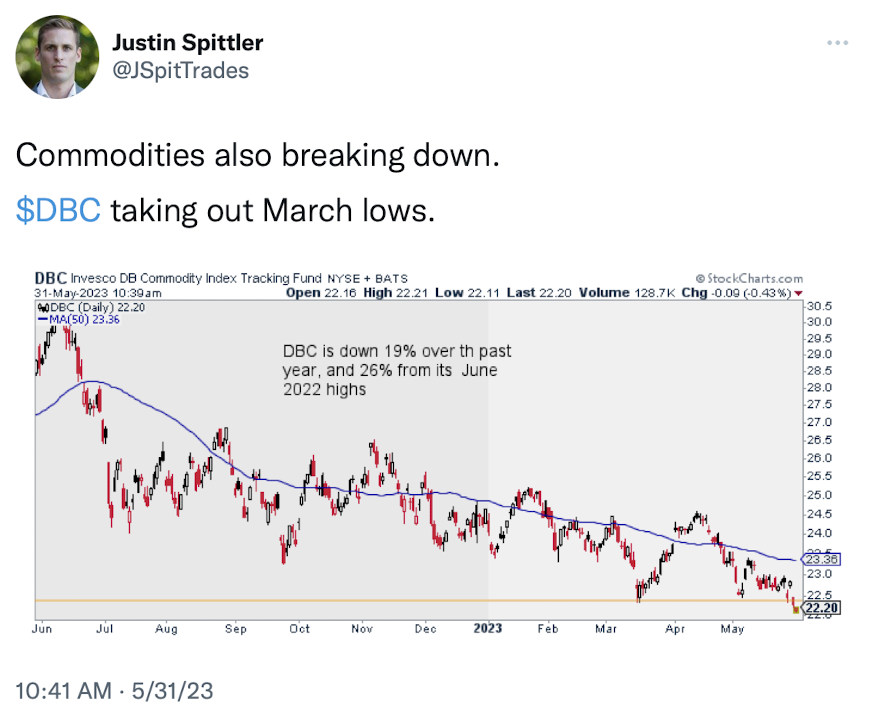
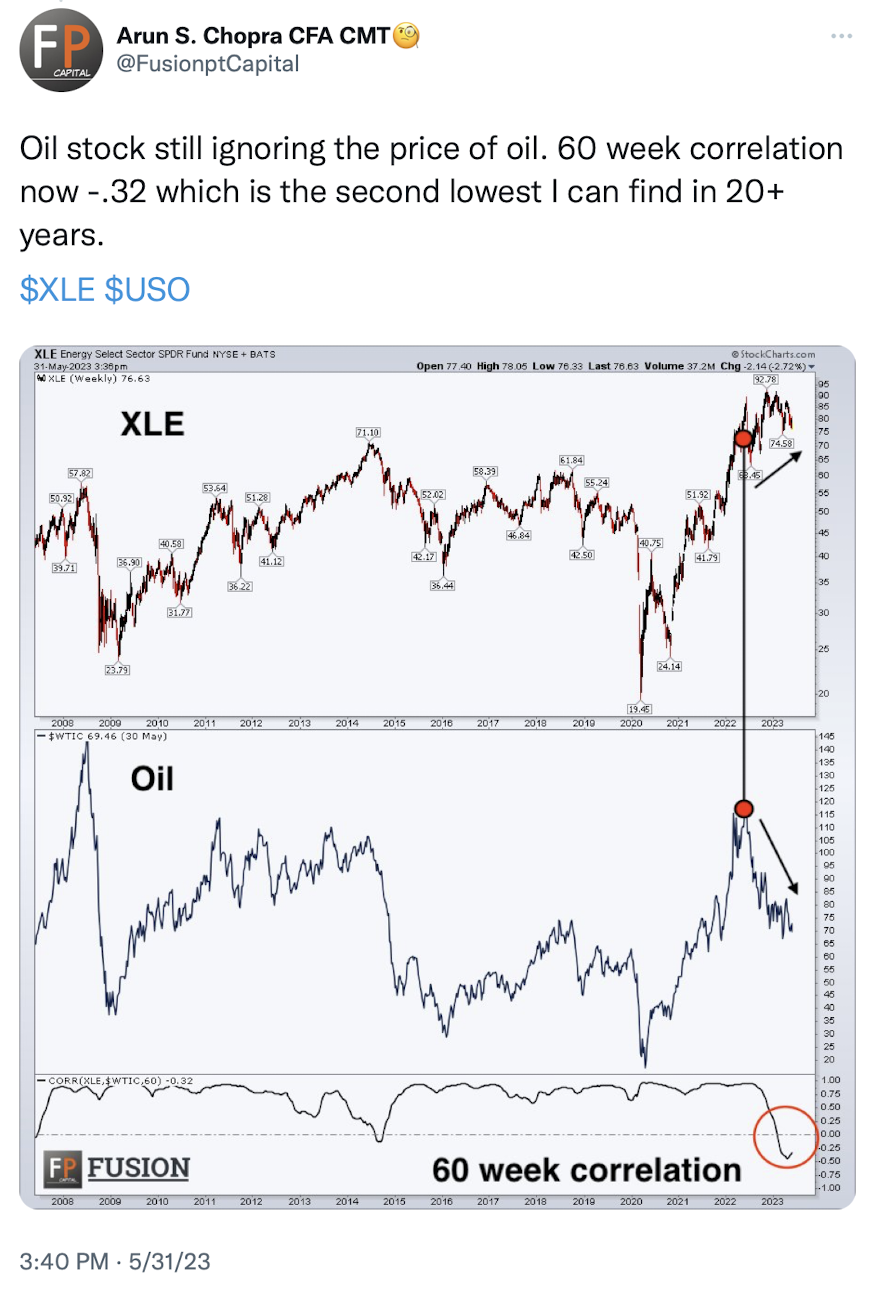
Top Tweets
You’re all caught up now. Thanks for reading!

