Daily Chart Report 📈 Tuesday, June 13, 2023
Powered By:

Today’s Summary
Tuesday, June 13, 2023
Indices: Russell 2000 +1.23% | Nasdaq 100 +0.79% | S&P 500 +0.69% | Dow +0.43%
Sectors: 10 of the 11 sectors closed higher. Materials led by a wide margin, gaining +2.32%. Utilities was the only sector that closed lower, but it was essentially flat (-0.02%).
Commodities: Crude Oil futures rose +3.43% to $69.42 per barrel. Gold futures fell -0.56% to $1,959 per oz.
Currencies: The US Dollar Index fell -0.31% to $103.31.
Crypto: Bitcoin barely moved for the third straight day (+0.11%) and remains around $25,934. Ethereum inched lower by just -0.19% to $1,739.
Interest Rates: The US 10-year Treasury yield rose to 3.819%.
Here are the best charts, articles, and ideas being shared on the web today!
Chart of the Day
The S&P 500 Percentage of stocks above its 20-day moving average is now just eclipsing the 80% level.
While it indicates risk/reward on the rally is diminishing, it can remain elevated for weeks.
$SPY pic.twitter.com/XM5at0jrSz— Matthew Timpane, CMT (@mtimpane) June 13, 2023
Today’s Chart of the Day was shared by Matthew Timpane (@mtimpane). The chart shows the percentage of S&P 500 stocks above their 20-day moving average (over the past year), with the S&P 500 in the lower panel. Matthew points out that, as of today’s close, 82% of S&P 500 stocks are above their 20-day moving average. While short-term breadth is reaching overbought levels (above 80%), long-term breadth is just starting to return to healthy levels (above 50%). 64% of S&P 500 stocks are above their 50-day moving average, and 61% are above their 200-day moving average. Risk/reward is diminishing in the near term, but it’s hard to view this as bearish. If anything, bulls should embrace this, considering that everyone was losing their minds over weak breadth and narrow participation just a couple of weeks ago.
Quote of the Day
“When perception diverges from reality, it creates opportunity for us as financial market participants.”
– Todd Sohn
Top Links
Why Strong Stock Returns on Friday is Bullish – Carson Group
Ryan Detrick points out that Thursdays and Fridays have been particularly strong in 2023.
Cyclicals Continue To Help Broaden The Markets Out Beyond Tech – StockCharts.com
Mary Ellen McGonagle highlights the newfound strength in the equal-weight S&P 500.
Key Consumer ETF Ratio Bullish Head & Shoulders Breakout! – Kimble Charting Solutions
Chris Kimble points out that the Consumer Discretionary sector just broke out relative to the Consumer Staples sector ($XLY/$XLP).
The Story Being Told By The Charts – Ciovacco Capital Management
Chris Ciovacco shares several charts that speak to the current market environment.
More Balanced June – Bespoke
Bespoke looks at the recent expansion in sector participation.
The Chart Report is now better than ever…
Introducing The Chart Report: Private Access.
Private Access is everything you love about The Chart Report – plus MORE charts, trade ideas, and access to our exclusive scans and model portfolio updates.

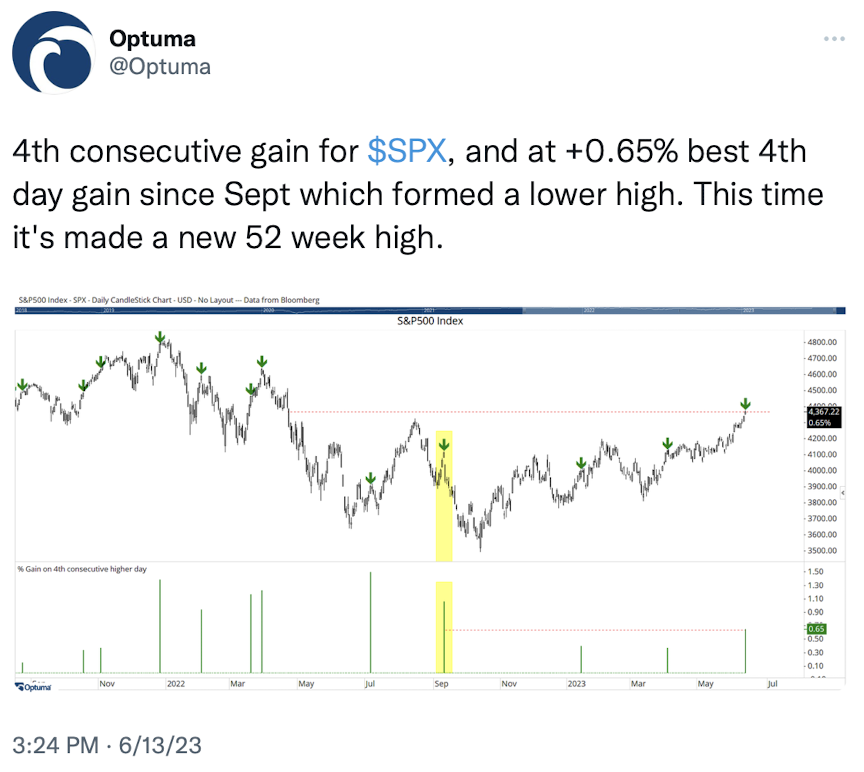
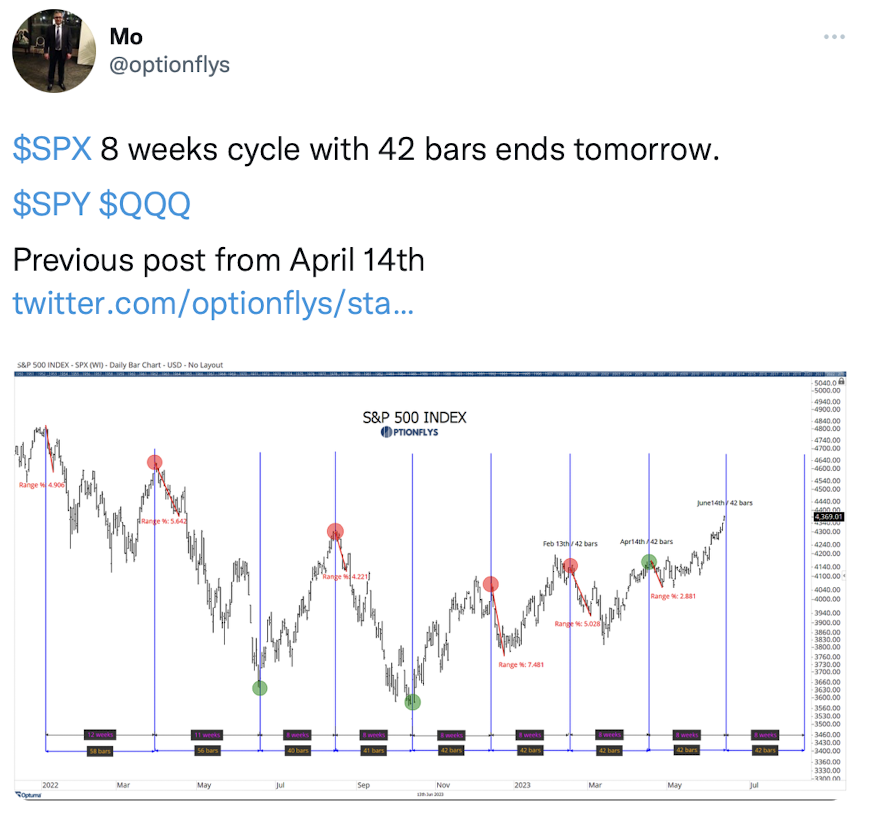
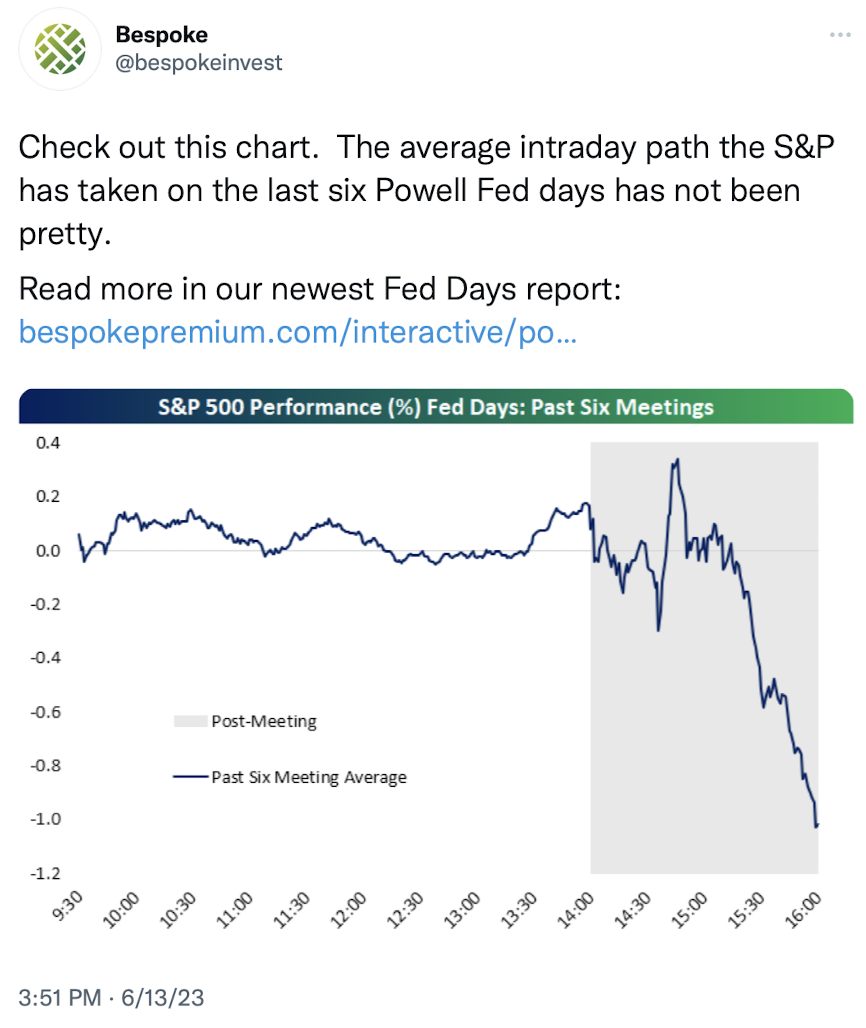
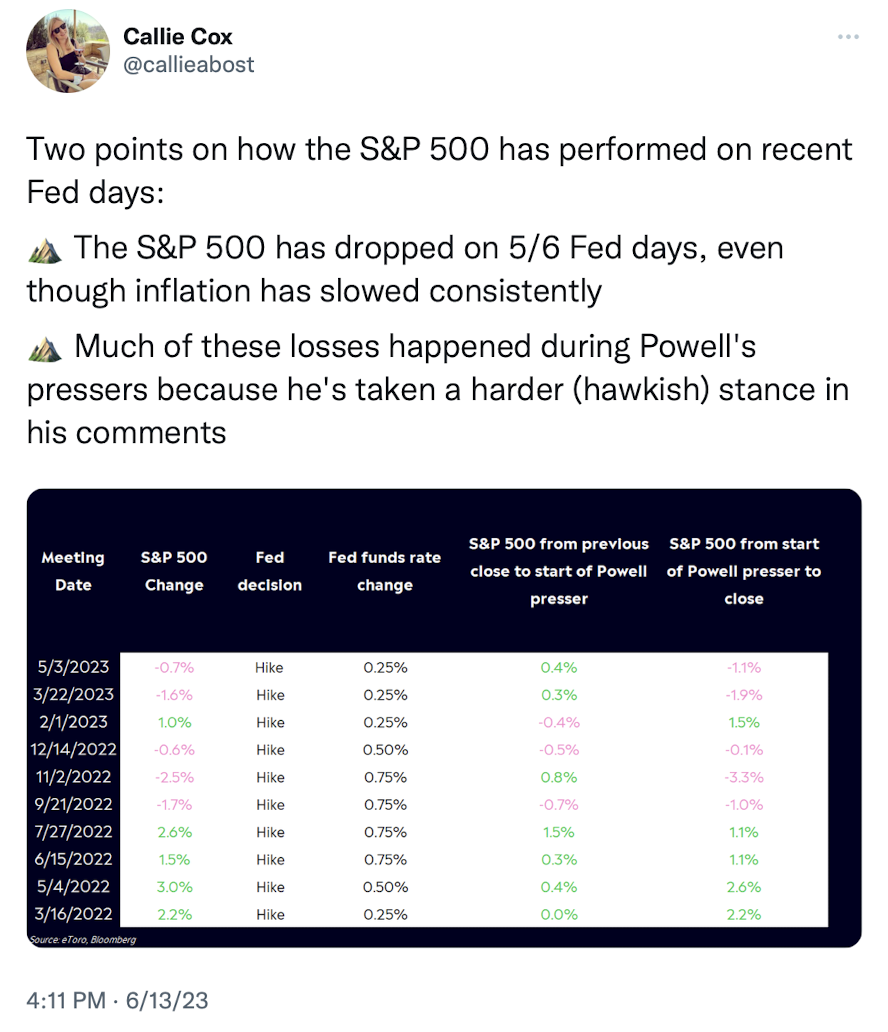
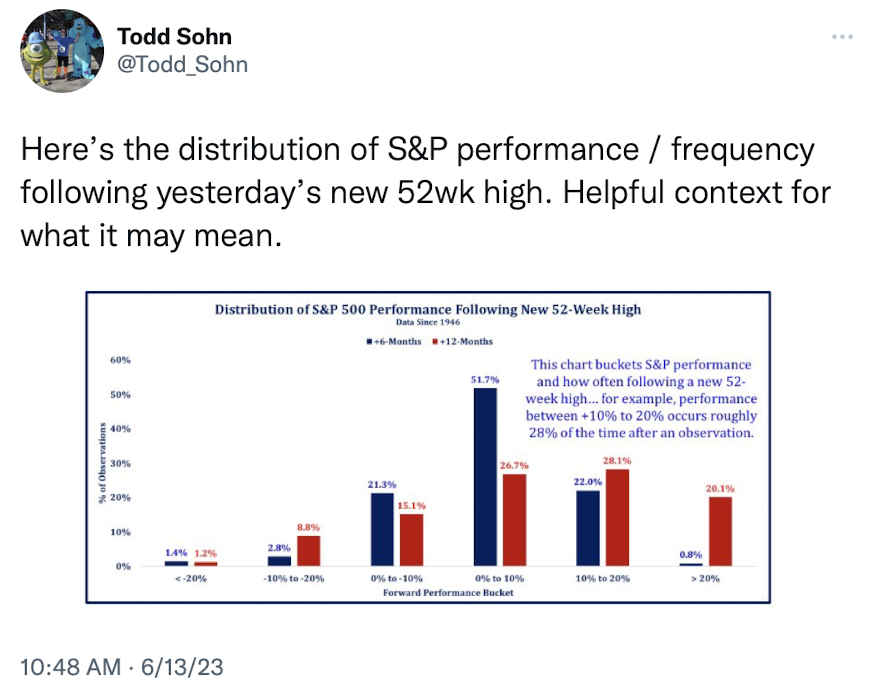
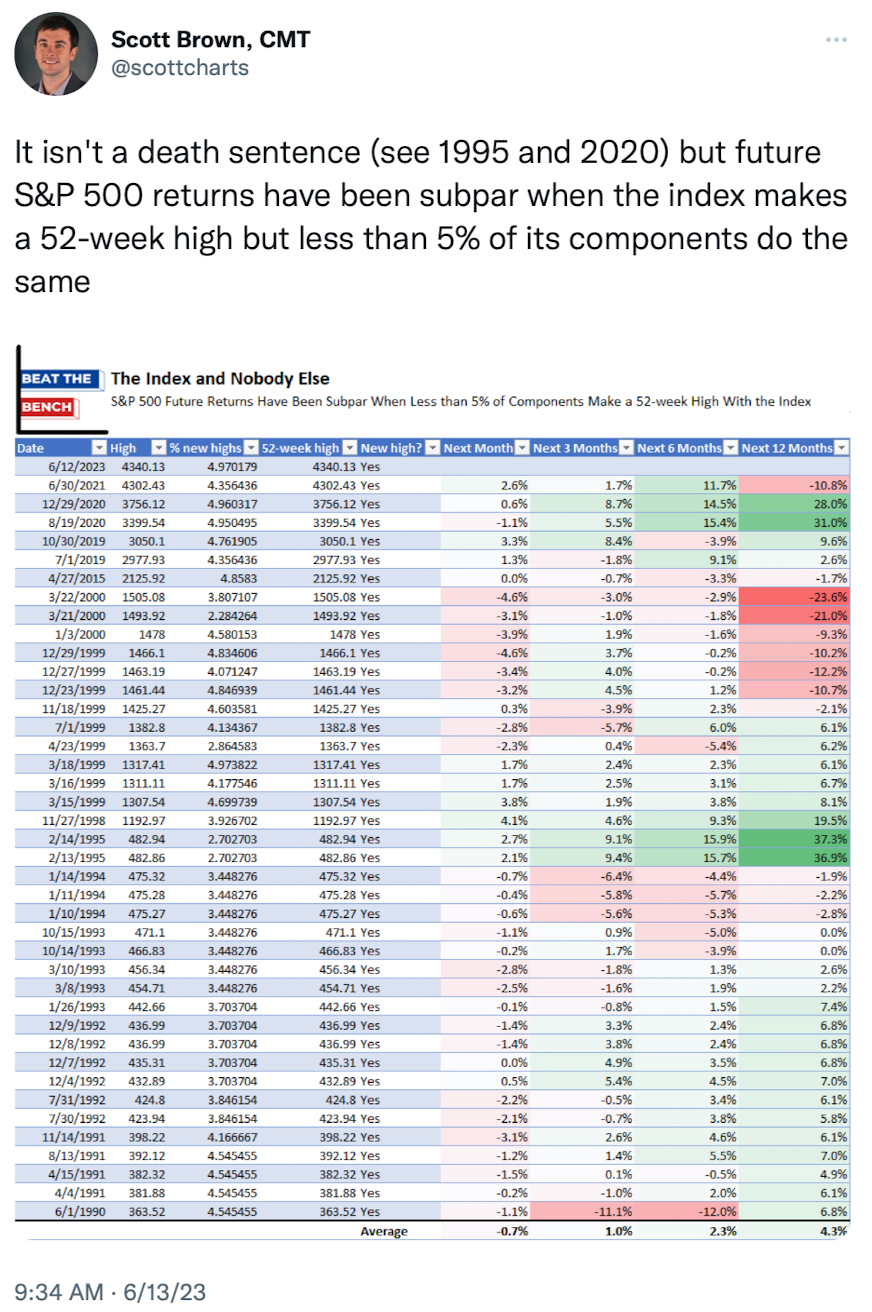
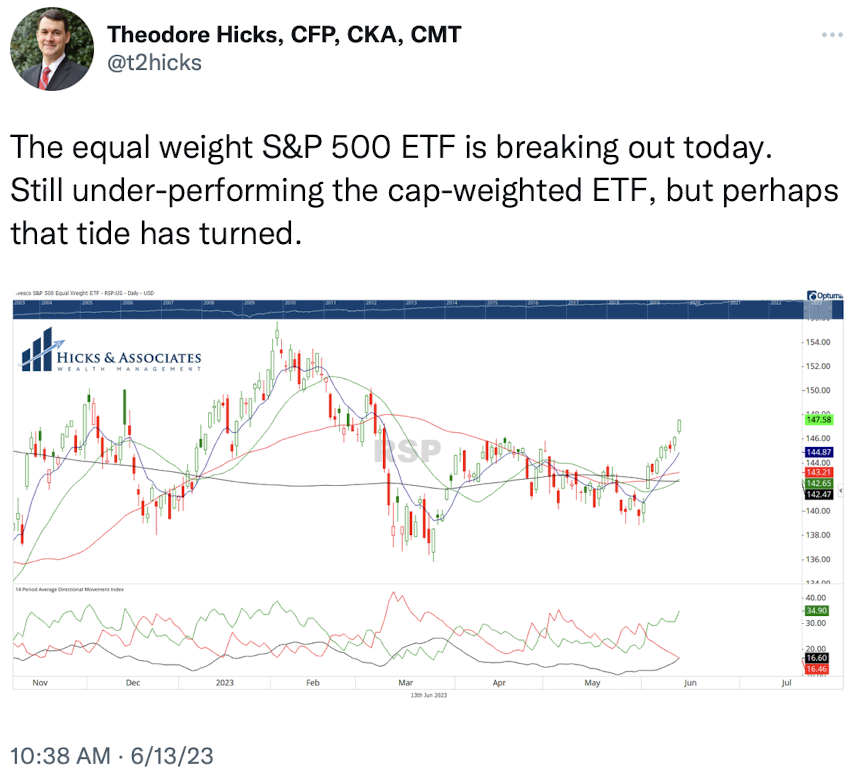
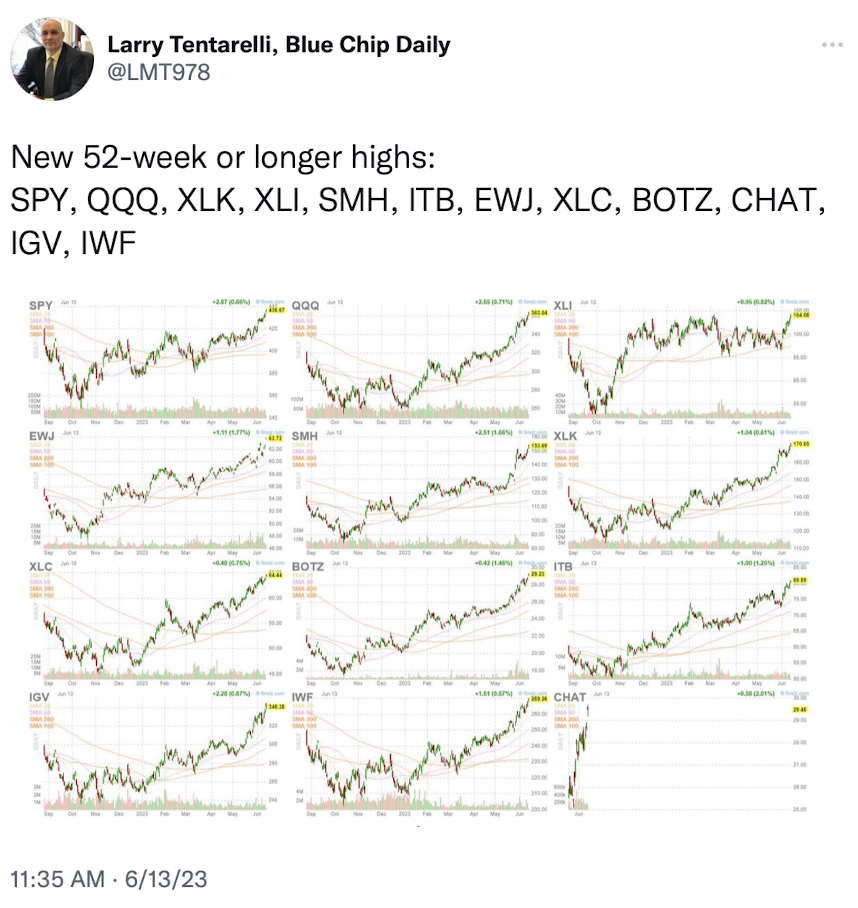
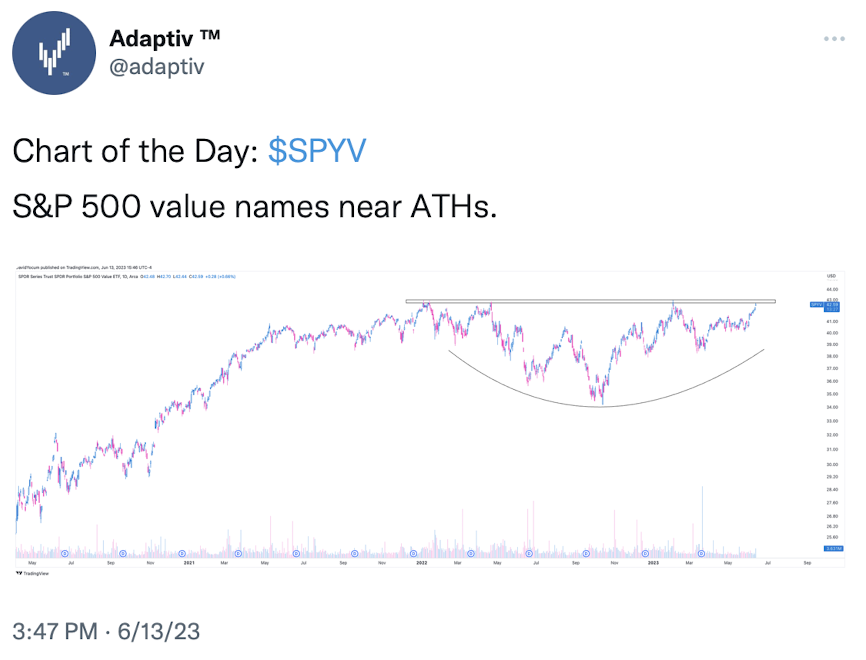
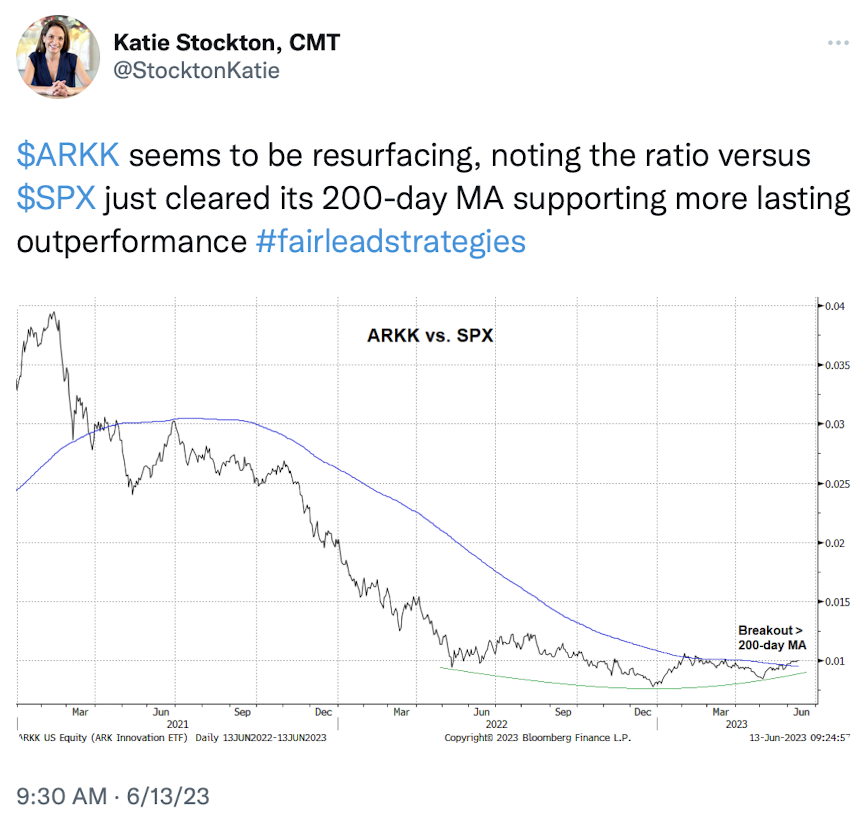
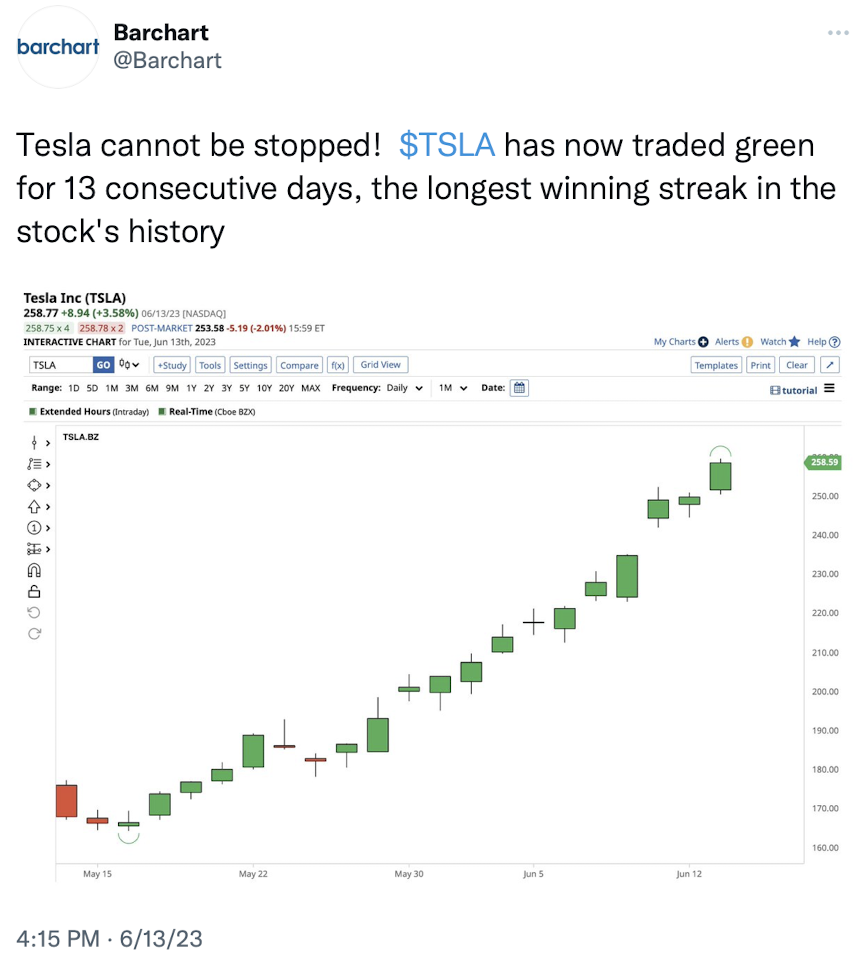
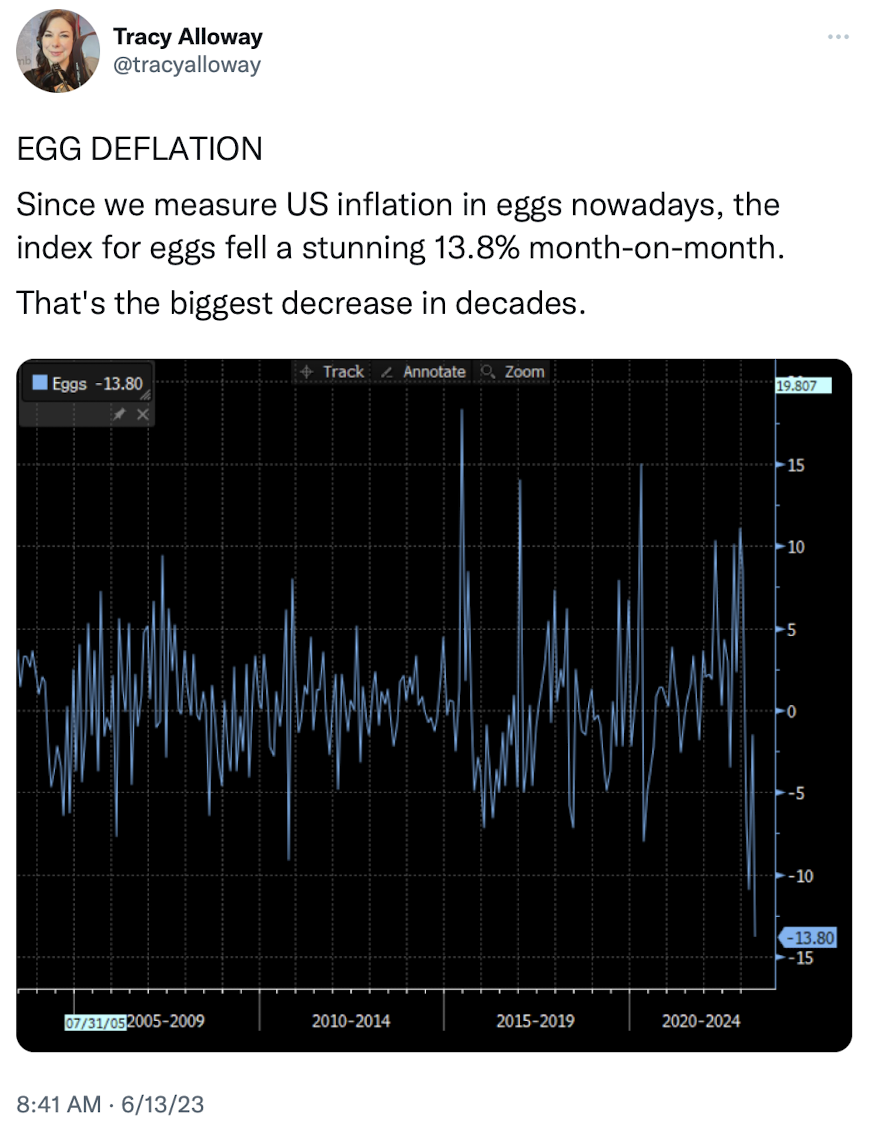
Top Tweets
You’re all caught up now. Thanks for reading!