Daily Chart Report 📈 Wednesday, June 14, 2023
Powered By:

Today’s Summary
Wednesday, June 14, 2023
Indices: Nasdaq 100 +0.70% | S&P 500 +0.08% | Dow -0.68% | Russell 2000 -1.17%
Sectors: 4 of the 11 sectors closed higher. Tech led, gaining +1.03%. Health Care lagged, falling -1.03%.
Commodities: Crude Oil futures fell -1.66% to $68.27 per barrel. Gold futures rose +0.53% to $1,969 per oz.
Currencies: The US Dollar Index fell -0.29% to $103.00.
Crypto: Bitcoin fell -3.56% to $25,012. Ethereum dropped -5.27% to $1,648.
Interest Rates: The US 10-year Treasury yield fell to 3.792%.
Here are the best charts, articles, and ideas being shared on the web today!
Chart of the Day
No real #FOMC action just a lot of chop $SPY pic.twitter.com/4s3wh2OdDq
— Michael Nauss, CMT, CAIA 🇨🇦 (@MichaelNaussCMT) June 14, 2023
Today’s Chart of the Day was shared by Michael Nauss (@MichaelNaussCMT). The S&P 500 was essentially unchanged today, closing higher by a paltry +0.08%. It wasn’t much, but it was enough to mark a new 52-week high and the first five day winning streak for the S&P 500 since November 2021. Many were anticipating a large move today on the heels of the Fed’s interest rate decision and Powell’s comments. But, the market did what it does best and fooled the majority, leaving both the bulls and bears dissatisfied. Michael points out that today’s price action formed a doji candle on the daily chart of $SPY. This candlestick formation represents indecision between buyers & sellers. While it doesn’t tell you much on it’s own, a doji candle often marks a brief moment of equilibrium before a larger continuation higher or a reversal lower.
Quote of the Day
“Go long when stocks reach a new high.
Sell short when they reach a new low.”
– Jesse Livermore
Top Links
Schaeffer’s Investment Research
Rocky White examines how the S&P 500 has historically performed after printing a new 52-week high for the first time in several months.
Record Nasdaq Outperformance is Usually a Sign of Good Things to Come – Nasdaq
Brian Joyce and the Nasdaq’s market intelligence team analyze what the Nasdaq’s recent outperformance could mean for the broader market outlook.
Fed Day Doldrums? – Trading Adventures
Andy Moss gives a midweek update on price action in the major indices.
Now They Turn Bullish? – Carson Group
Ryan Detrick looks at the resurgence of bullish sentiment.
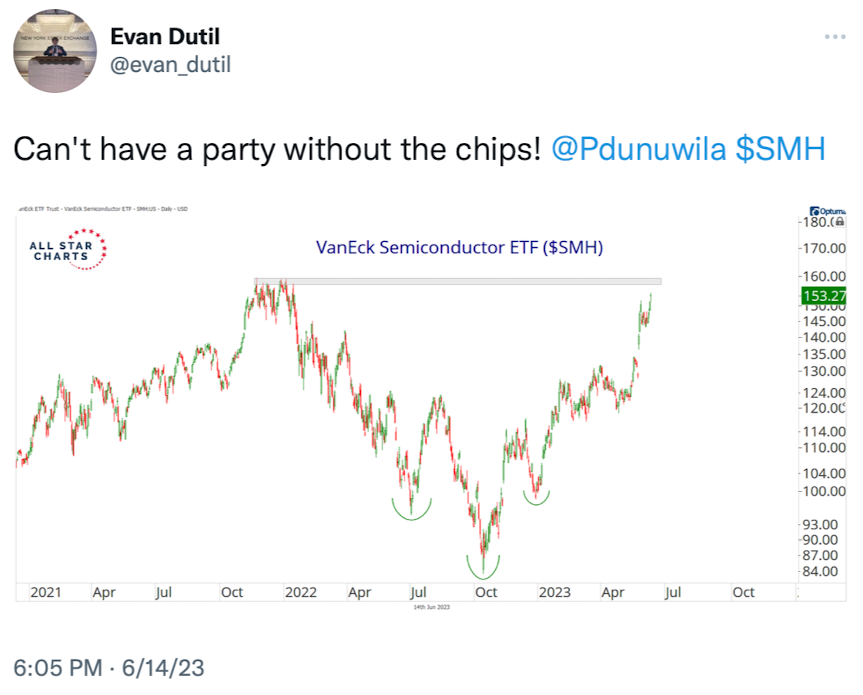
Semiconductors ETF (SMH) Nearing “Super” Breakout/Resistance Level! – Kimble Charting Solutions
Chris Kimble points out that the strongest industry group YTD (Semiconductors $SMH) is attempting to breakout to all-time highs.
The Chart Report is now better than ever…
Introducing The Chart Report: Private Access.
Private Access is everything you love about The Chart Report – plus MORE charts, trade ideas, and access to our exclusive scans and model portfolio updates.

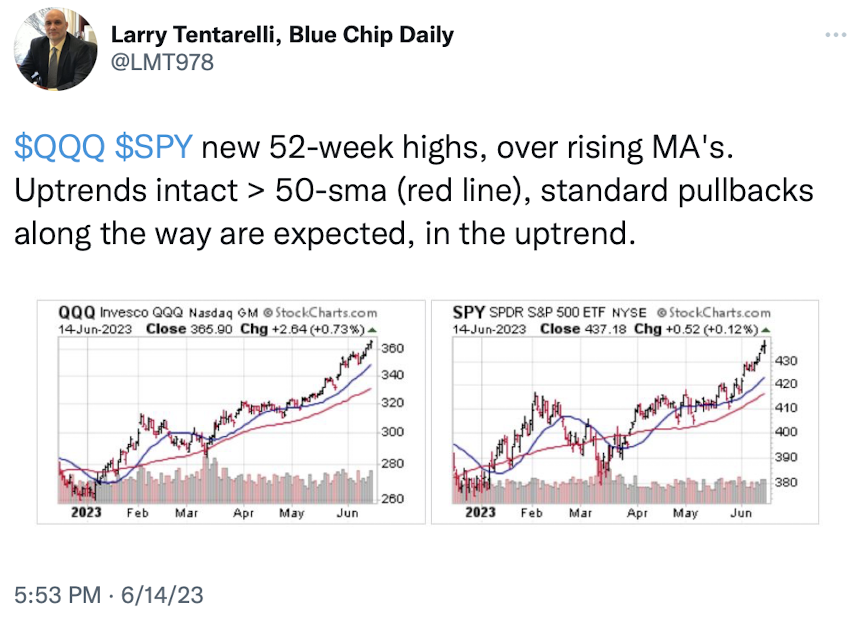
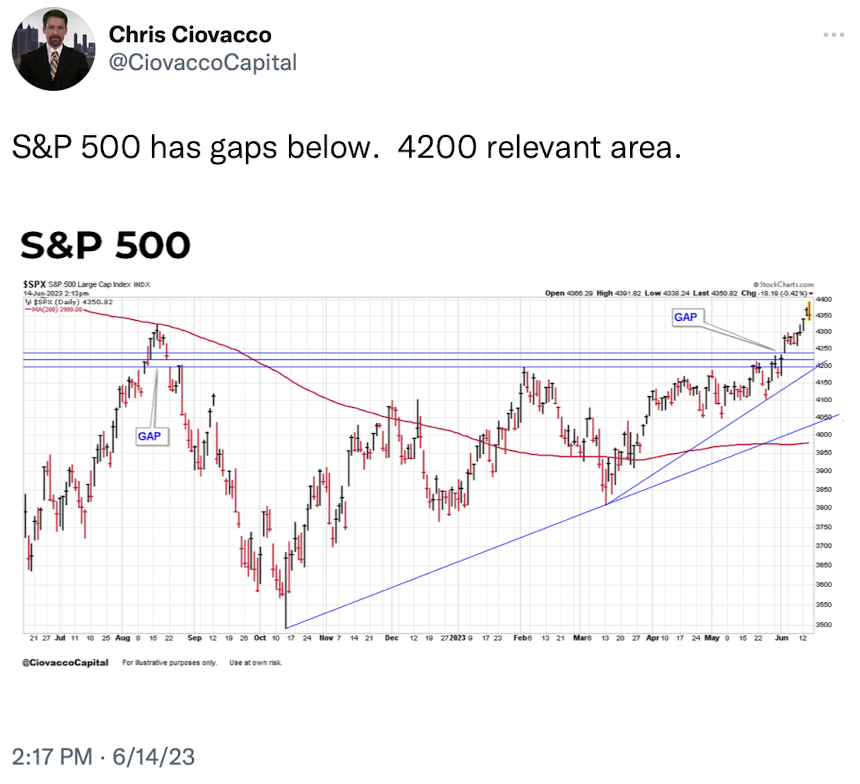
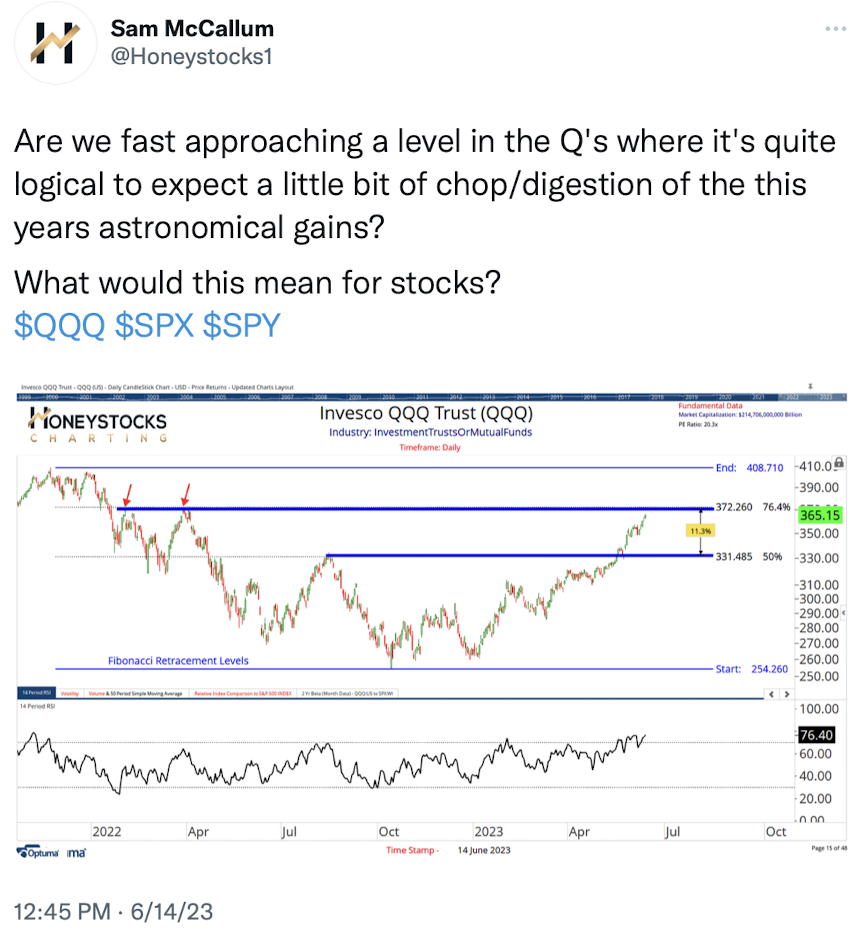
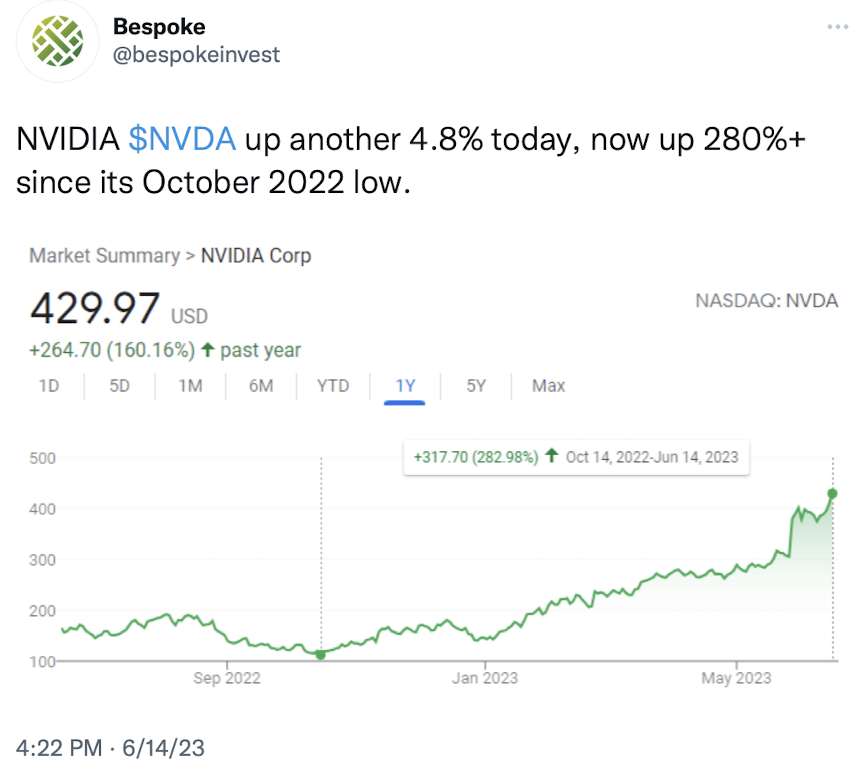
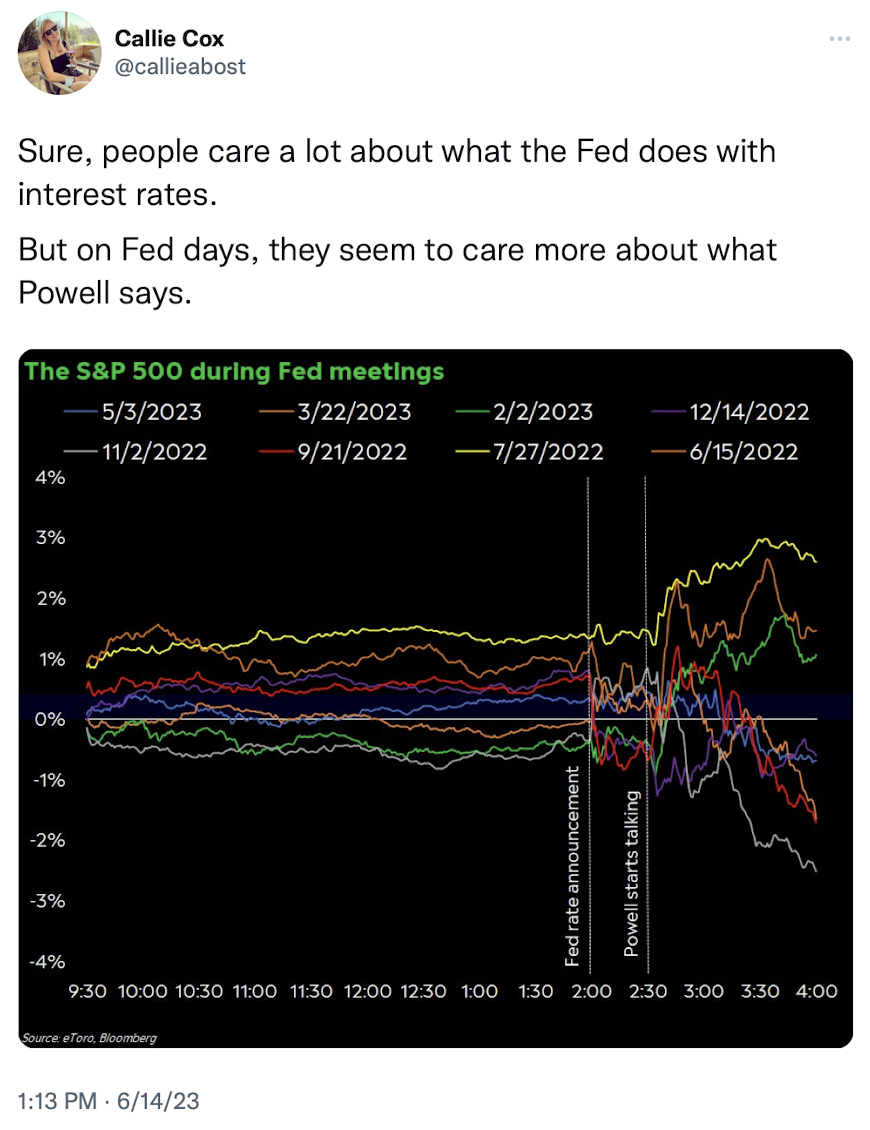
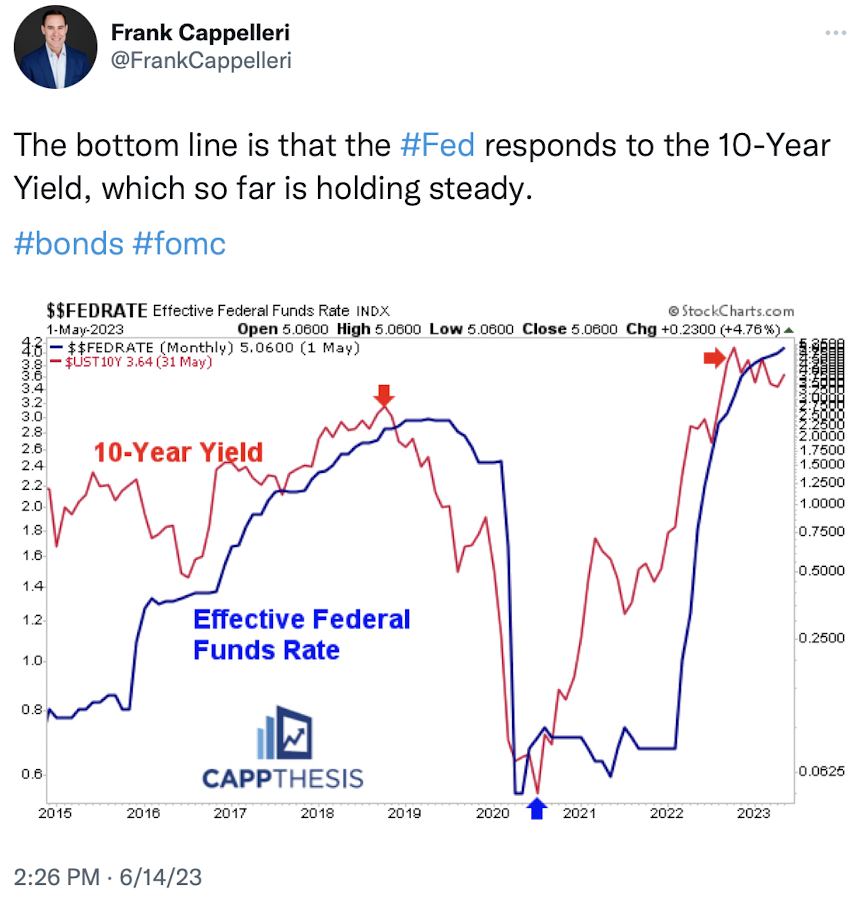
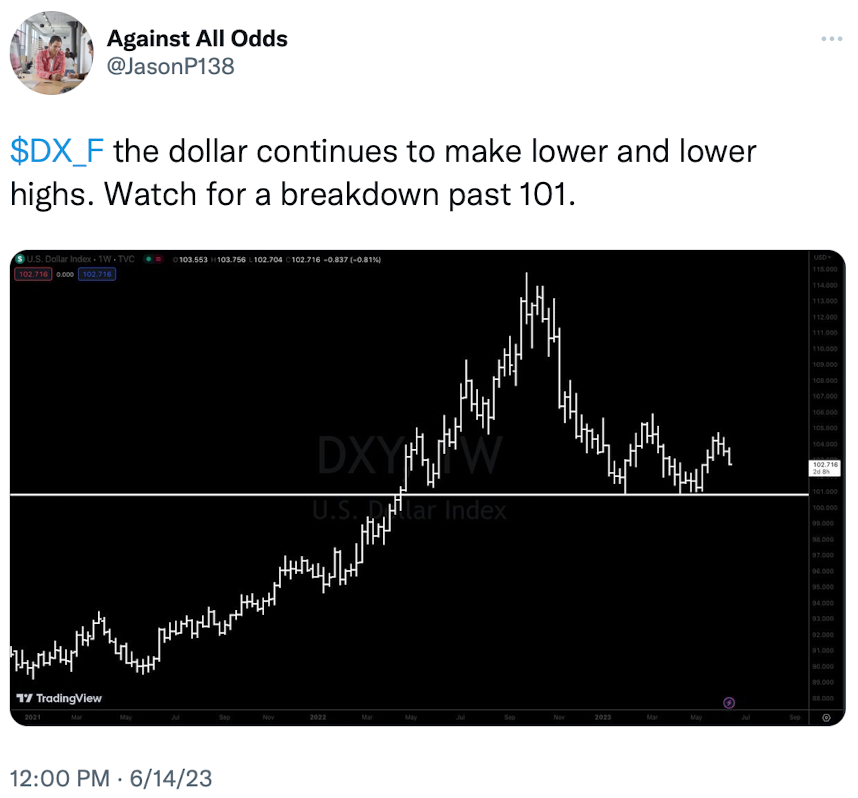
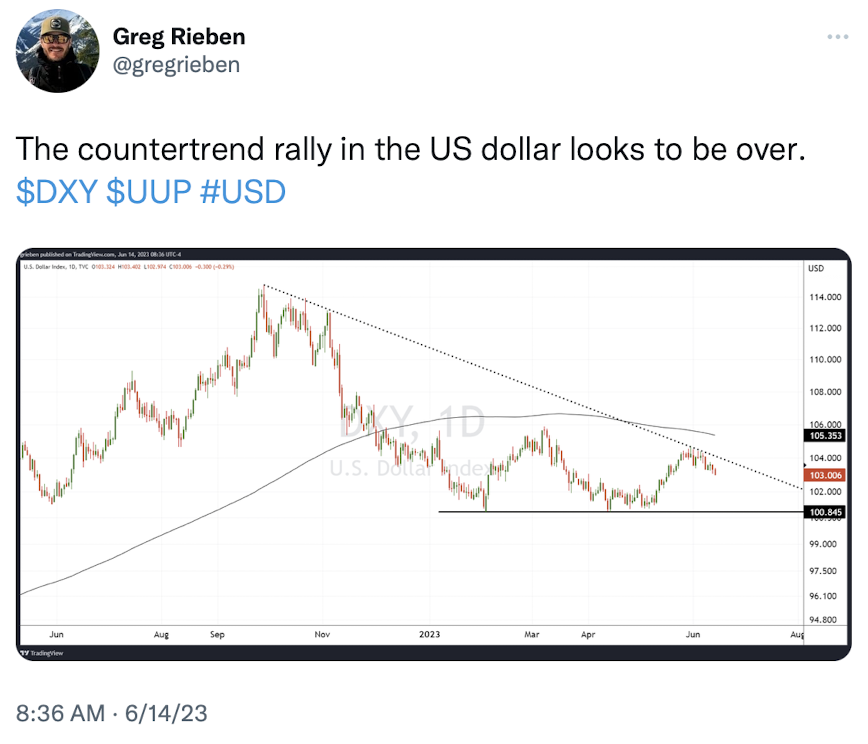
Top Tweets