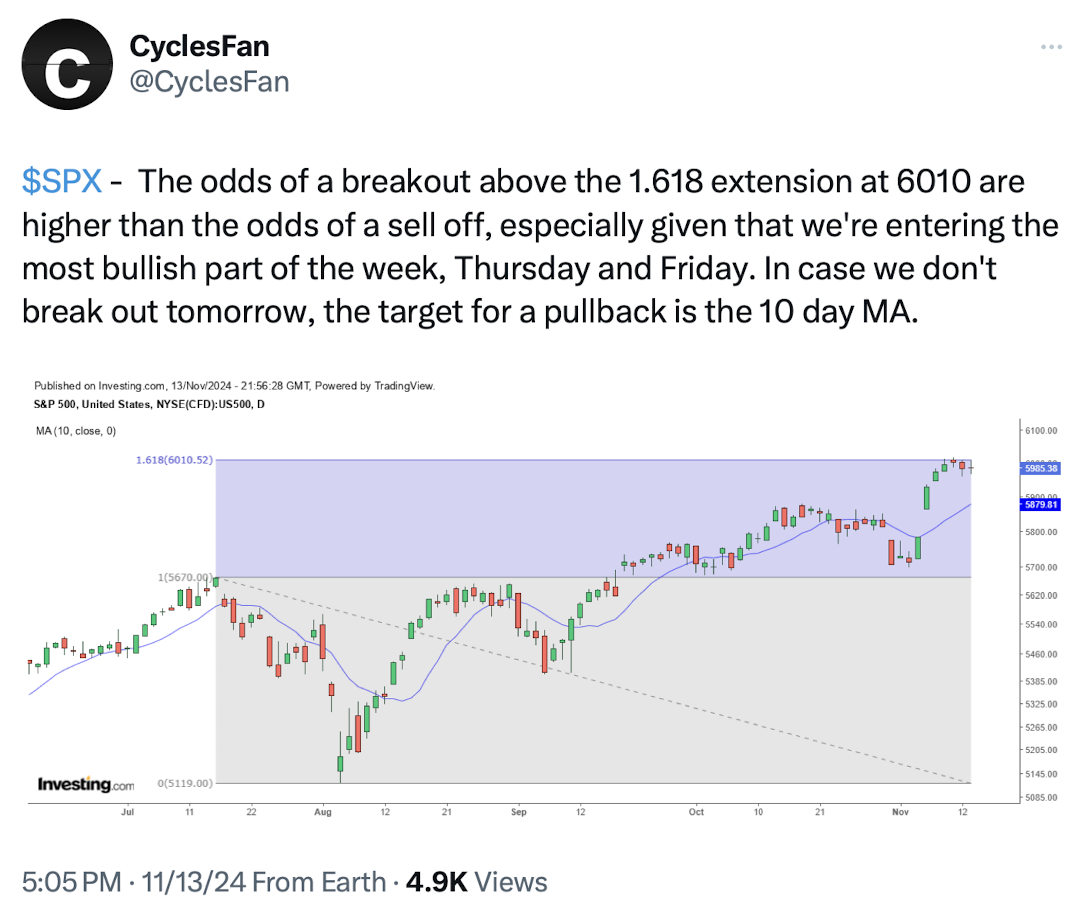
Chart of the Day - Wednesday, November 13, 2024
November 13, 2024
Chart of the Day
🏆 Today's Chart of the Day was shared by @CyclesFan.
- The S&P 500 has been in a tight range all week, moving less than 50bps in either direction as it digests last week's +5% post-election rally.
- It began stalling around 6,000 on Friday after gapping higher for four consecutive days. This round number isn't just a key psychological level; it also represents the 161.8% Fibonacci extension of the July correction. The next Fib-extension is +9.5% higher, at 6,380.
- After consolidating at 6,000 over the past three sessions, @CyclesFan points out that the odds of a breakout are greater than the odds of a retest, as Thursdays and Fridays have been the best days of the week in 2024.
The Takeaway: After a strong post-election rally, the S&P 500 has stalled at a natural resistance level this week, consolidating in a tight range below 6,000. A breakout would clear the way for a potential +9.5% rally to 6,380 in the coming weeks/months.
