Chart of the Day - Monday, March 10, 2025
March 10, 2025
Chart of the Day
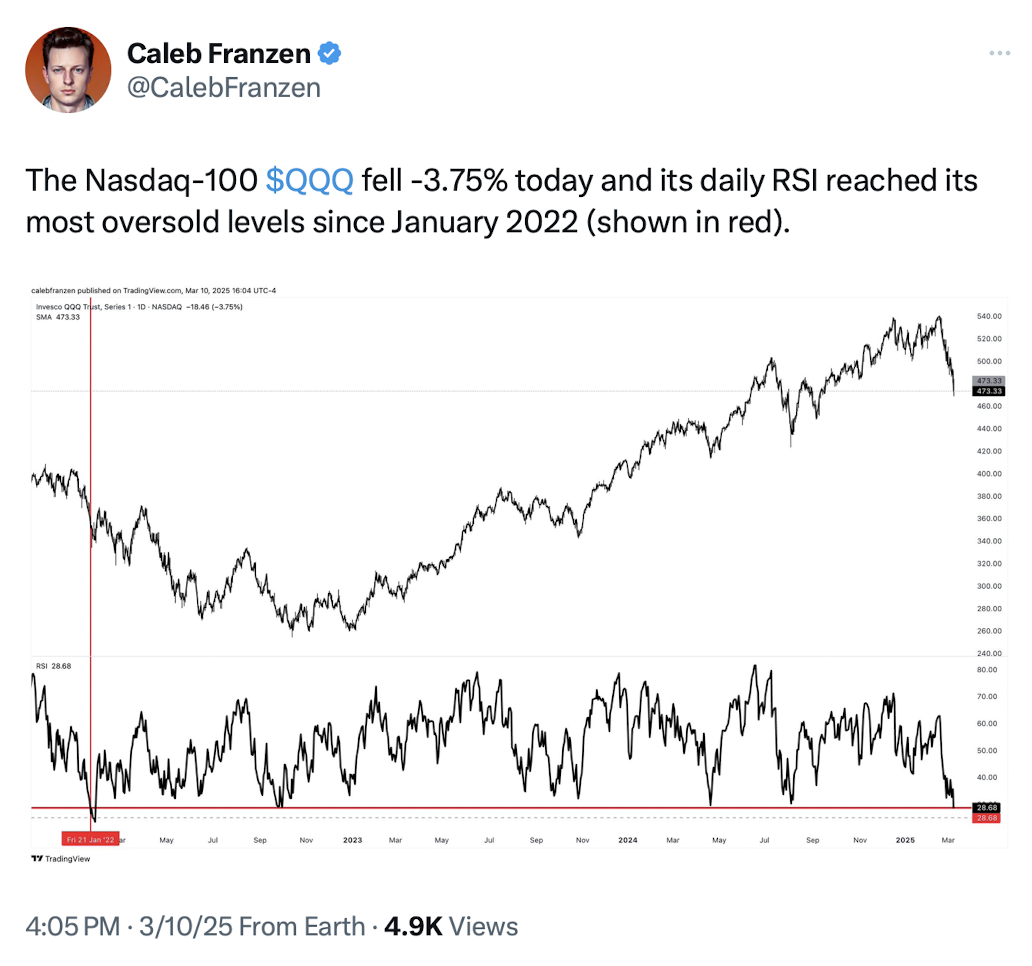
🏆 Today's Chart of the Day was shared by Caleb Franzen (@CalebFranzen).
- Today was the worst day for the Nasdaq 100 since September 2022, with $QQQ dropping -3.9%. It closed at a six-month low, sliding -12.4% from a record high in less than a month.
- Caleb points out that RSI has reached its lowest levels since January 2022. $QQQ was in a similar drawdown when RSI reached these levels in January 2022, but price fell another -23% before bottoming in Q4 2022.
- Price and momentum are confirming one another by making new lows simultaneously. 'Oversold' might sound bullish at first. After all, it sounds like selling has been overdone. However, price usually doesn't bottom immediately after its first oversold reading from overbought territory.
The Takeaway: Today was the worst day for the Nasdaq 100 ($QQQ) since September 2022. More notably, momentum is confirming the recent weakness, with RSI reaching levels not seen since the initial drop of the 2022 bear market.