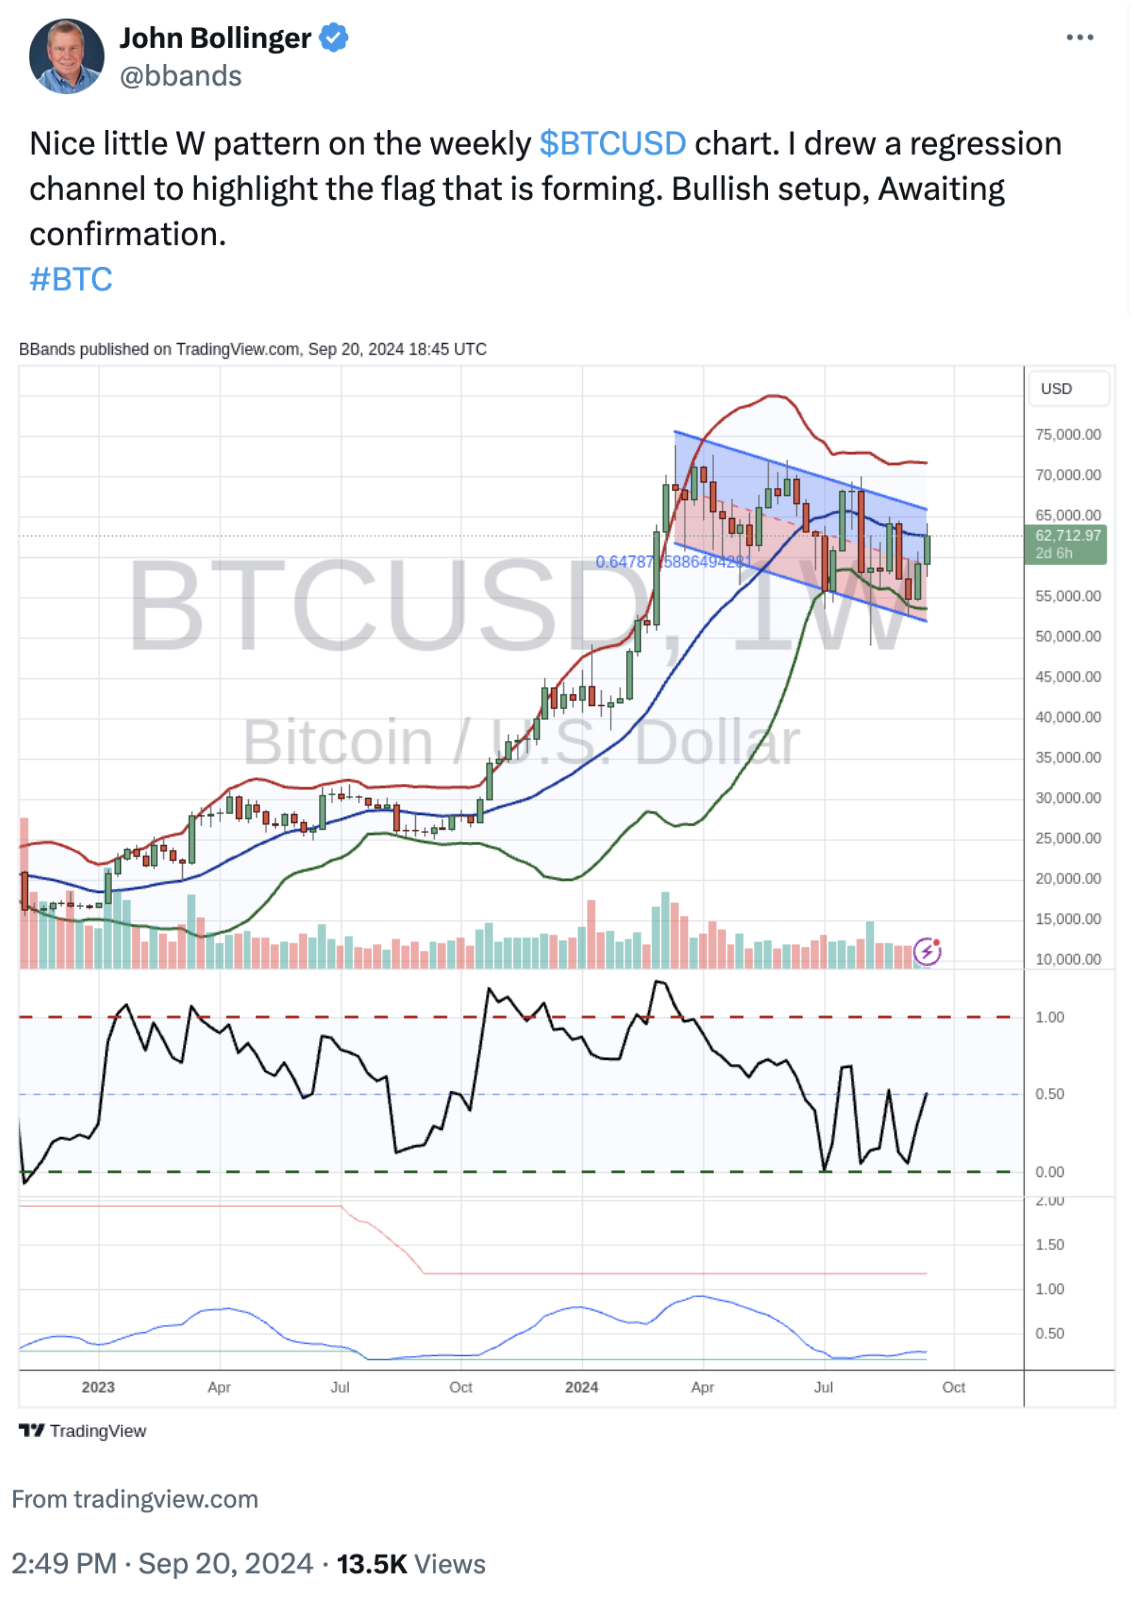
Chart of the Day - Friday, September 20, 2024
September 20, 2024
🏆 Today's Chart of the Day was shared by John Bollinger (@bbands).
- Bitcoin has been in a falling channel since the breakout failed in March. However, that falling channel is beginning to look like one giant Bull Flag within a long-term uptrend.
- John points out that Bitcoin has formed a W Bottom within this bull flag. John popularized this bullish reversal pattern, which incorporates his famous Bollinger Bands. It will be confirmed on a weekly close above the middle band (around $63k).
- The pattern requires:
1.) A close below the lower band
2.) A bounce to the middle band
3.) A lower low that does not close outside the lower band.
Takeaway: Bitcoin has formed a bullish reversal pattern within a downtrend, and the downtrend looks like a bullish continuation pattern within a longer-term uptrend.
