Sponsored By:

Today’s Summary
Tuesday, March 26th, 2019
Indices: US stocks were higher across the board, with the Dow Jones Industrial Average gaining 141 points or 0.55%. The small-cap Russell 2000 outperformed the rest of the indices closing up 1.01%.
Sectors: All 11 sectors of the S&P 500 finished positive. The Energy sector led, closing up 1.44%, while the Consumer Discretionary sector lagged closing up 0.43%.
Commodities: WTI Crude Oil futures gained 1.9% to settle at $59.94 per barrel. Gold futures fell 0.6% to settle at $1,315 per ounce.
Currencies: The US Dollar Index gained 0.23%.
Interest Rates: The US 10-year Treasury yield continued to fall to where it currently sits at 2.425%.
Here are some of the best charts, articles, and ideas being shared on the web today!
Chart of the Day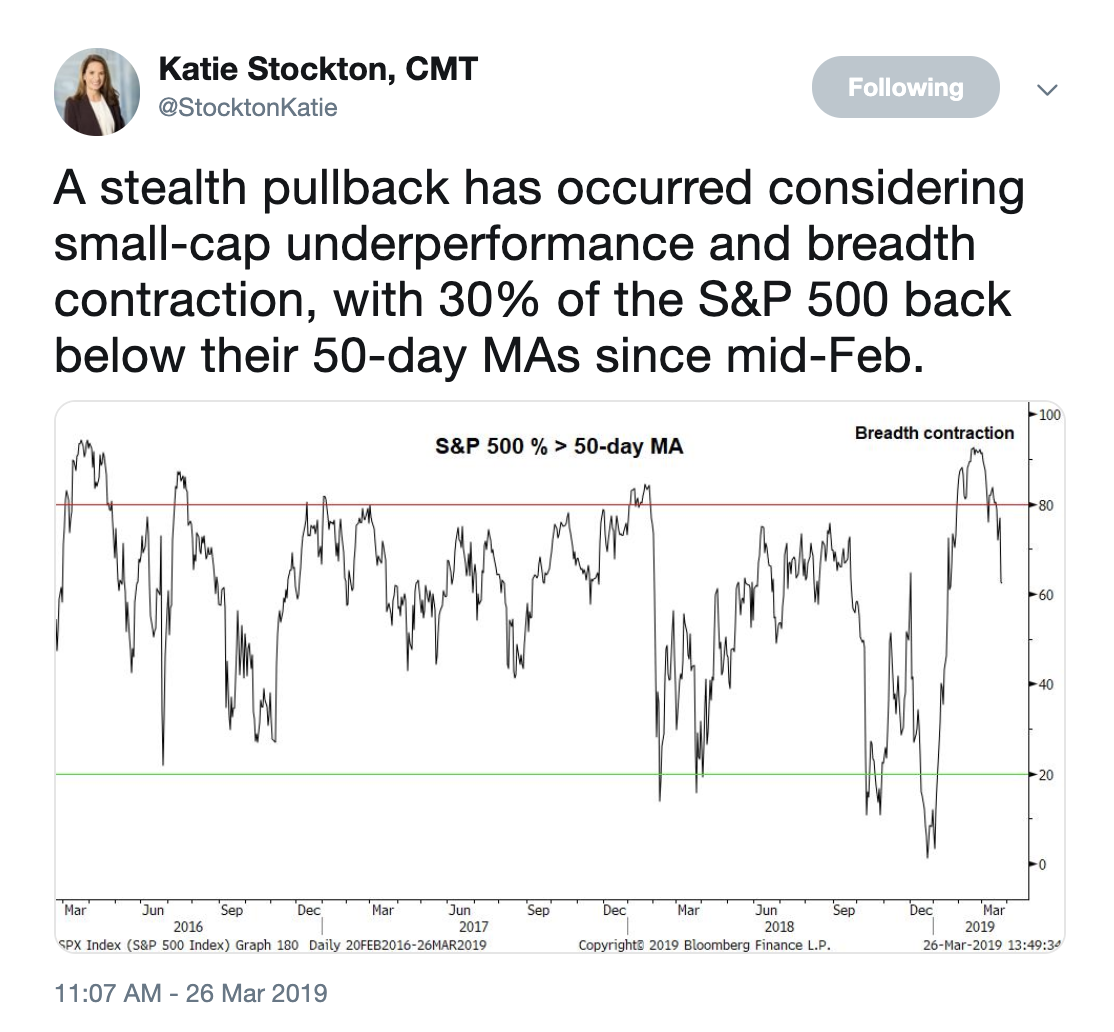
Today’s chart of the day was shared on Twitter by Katie Stockton, (@StocktonKatie). It’s a chart of the percentage of stocks above their 50-day moving average in the S&P 500 index. The market has been in rally mode for the majority of 2019, with the S&P up over 20% year-to-date. Technical indicators have hit overbought levels causing many to expect a pullback here. Katie argues we’ve already begun to pullback with breadth deterioration and small-caps underperforming. She calls it a “stealth” pullback because the market is less than 2% off the year-to-date highs, so it doesn’t feel as though the market is weak. Going forward it would be wise to keep an eye on breadth as well as the relative performance of small-caps in order to get an idea of where the market is headed.
Quote of The Day
“The quality of our lives is the sum of decision quality plus luck ”
– Annie Duke (Professional Poker Player)
Rates Impacting Financials and Small-Caps
There’s been a lot of talk about interest rates lately as the benchmark 10-year Treasury yield sinks to new 52-week lows. This piece from The Chart Report discusses the impact lower rates are having on Financials and the Russell 2000.
Tremor in Treasuries – Greg Harmon
Here’s a quick read from Greg Harmon of Dragonfly Capital. He highlights the recent volatility in US Treasury yields and lays out what it means for bonds.
Small-Caps and Tech Closeout the Quarter on a Higher Note – Jeff Hirsch
This Friday is not only the last day of March but also the last day of Q1 2019. Jeff Hirsch found that historically, the Russell 2000 and Nasdaq tend to gain on the last day of March as portfolio managers make end of month/quarter portfolio adjustments.
Overthinking Intermarket Analysis Yield Curve Edition – All Star Charts
All the buzz about the yield curve lately has people speculating on what it will mean for other asset classes like stocks, commodities etc. JC Parets explains that people often overcomplicate intermarket analysis. He offers a simplified approach to thinking about relationships between asset classes.
Semiconductor Stocks Make Another Run at the Highs: Different This Time? – Chris Kimble
In this piece, Chris Kimble points out that the Semiconductor ETF ($SMH) is testing the highs from the year 2000. Kimble explains that Semiconductors are an important industry group to the economy and serve as a bellwether for the broader market.
Top 10 Tweets
The Optuma Breadth Module allows you to calculate average values for a universe, as well as % of true/false conditions. Currently the average RSI(14) of $SPX members is just above 50 and descending, showing negative divergence: pic.twitter.com/ZwL6IUFvqV
— Optuma (@Optuma) March 26, 2019
well defined risk near that $177 – $178 area. know your levels $QQQ pic.twitter.com/hzBwxXMIEa
— BostonCharts (@bostonchaahhts) March 26, 2019
If this year isn’t a replay of 2015-16, 2011-12, 1994-95 or 1987-88, it must definitely be 1998-99 all over again. Nice analogue chart from @TimmerFidelity. pic.twitter.com/vcXvb5VSpx
— Michael Santoli (@michaelsantoli) March 26, 2019
For me, the beginning of the end for this correction in U.S. stocks will be evidence of cyclical underperformance from Staples vs S&Ps. Last week's low in the $XLP / $SPY ratio is the one I'm watching closely pic.twitter.com/uq1vZOKfch
— J.C. Parets (@allstarcharts) March 26, 2019
It's notable how strong today's 2-year Treasury auction went, especially given that yields are near the lowest levels in more than a year. Indirect bidders bought the greatest proportion of the $40 billion sale since January 2018. pic.twitter.com/YWEi1ZiiWn
— Lisa Abramowicz (@lisaabramowicz1) March 26, 2019
The 2/10 yield curve spread will someday invert.
Just remember that the previous three times that happened the S&P 500 didn't peak for more than 20 months later and was up an average of more than 30%.
Also, all three times significantly outperformed the avg yearly return. pic.twitter.com/F0dvu7UTCv
— Ryan Detrick, CMT (@RyanDetrick) March 26, 2019
Yesterday saw the 5th largest single day rise in Treasury volatility in the last 10 years. $TYVIX $TNX $VIX pic.twitter.com/aP33WQ40tt
— Andrew Thrasher, CMT (@AndrewThrasher) March 26, 2019
Will this failed breakout in Palladium be the catalyst to finally drive the Platinum/Palladium ratio back above its 2001 lows, confirming a failed breakdown and bullish momentum divergence? pic.twitter.com/SvNrcyfvul
— Tom Bruni, CMT (@BruniCharting) March 26, 2019
Did you know that the U.S. stock market was in a 50 year bear market from 1790-1840?
Permbears and fintwit must have loved this at the time pic.twitter.com/fXmGczP6jc
— Troy Bombardia (@bullmarketsco) March 26, 2019
$INVH Invitation Homes Inc. 1D: new all time highs for this youngin. what a fake out.. pic.twitter.com/DK4GqQmEk9
— Shane C. Murphy (@murphycharts) March 26, 2019