Chart of the Day - Friday, December 18th, 2020

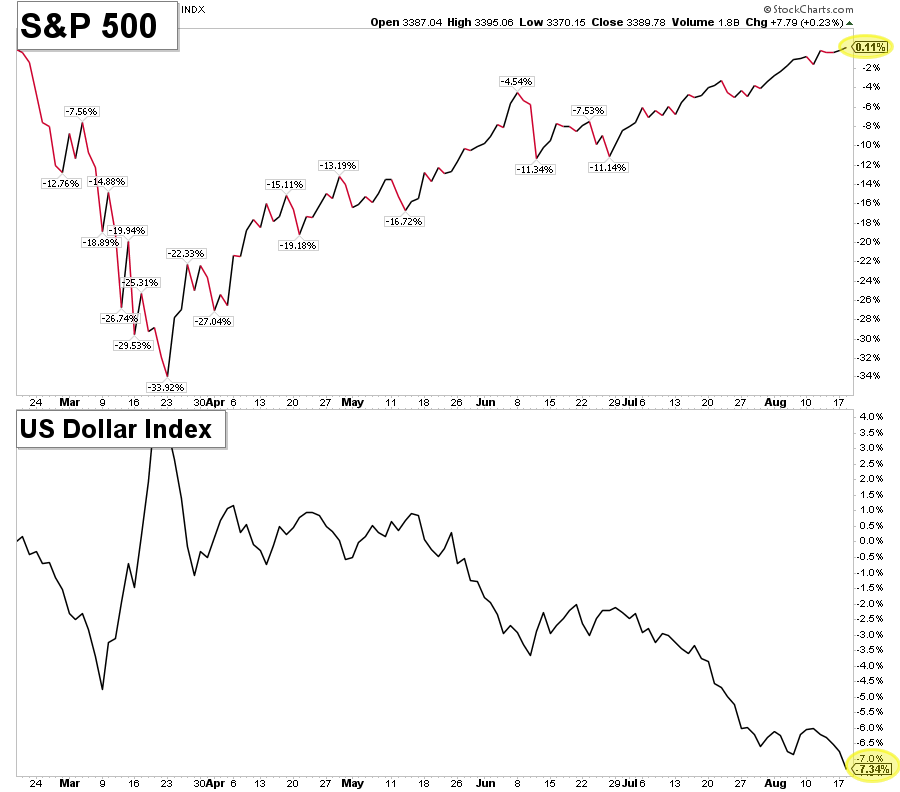
Today’s Chart of the Day was shared on Twitter by Shane Murphy (@murphycharts). It's a weekly candlestick chart of the US Dollar Index ($DXY) over the past 23 years. The US Dollar is one of the most important charts to watch out there right now. This is because so many of the trends and themes we've seen in recent months are related to the weakening Dollar. The S&P 500, Commodities, Emerging Markets, and even Bitcoin have all benefited from the Dollar decline. This might not surprise you considering these assets are priced in Dollars. So, it's literally the denominator of the equation. In a comment to the Chart Report, Shane said, "For starters, the Dollar is below a downward sloping 200-day moving average, so the path of least resistance is clearly lower. We sliced through key support around 92 a couple of weeks ago, and it's continued to make multi-year lows ever since. The next area of potential support is around 88. If that fails to hold, it could move significantly lower, which should continue to boost risk assets." For more perspective on this topic, check out this piece from Aaron Jackson, and this note from LPL Financial Research.

