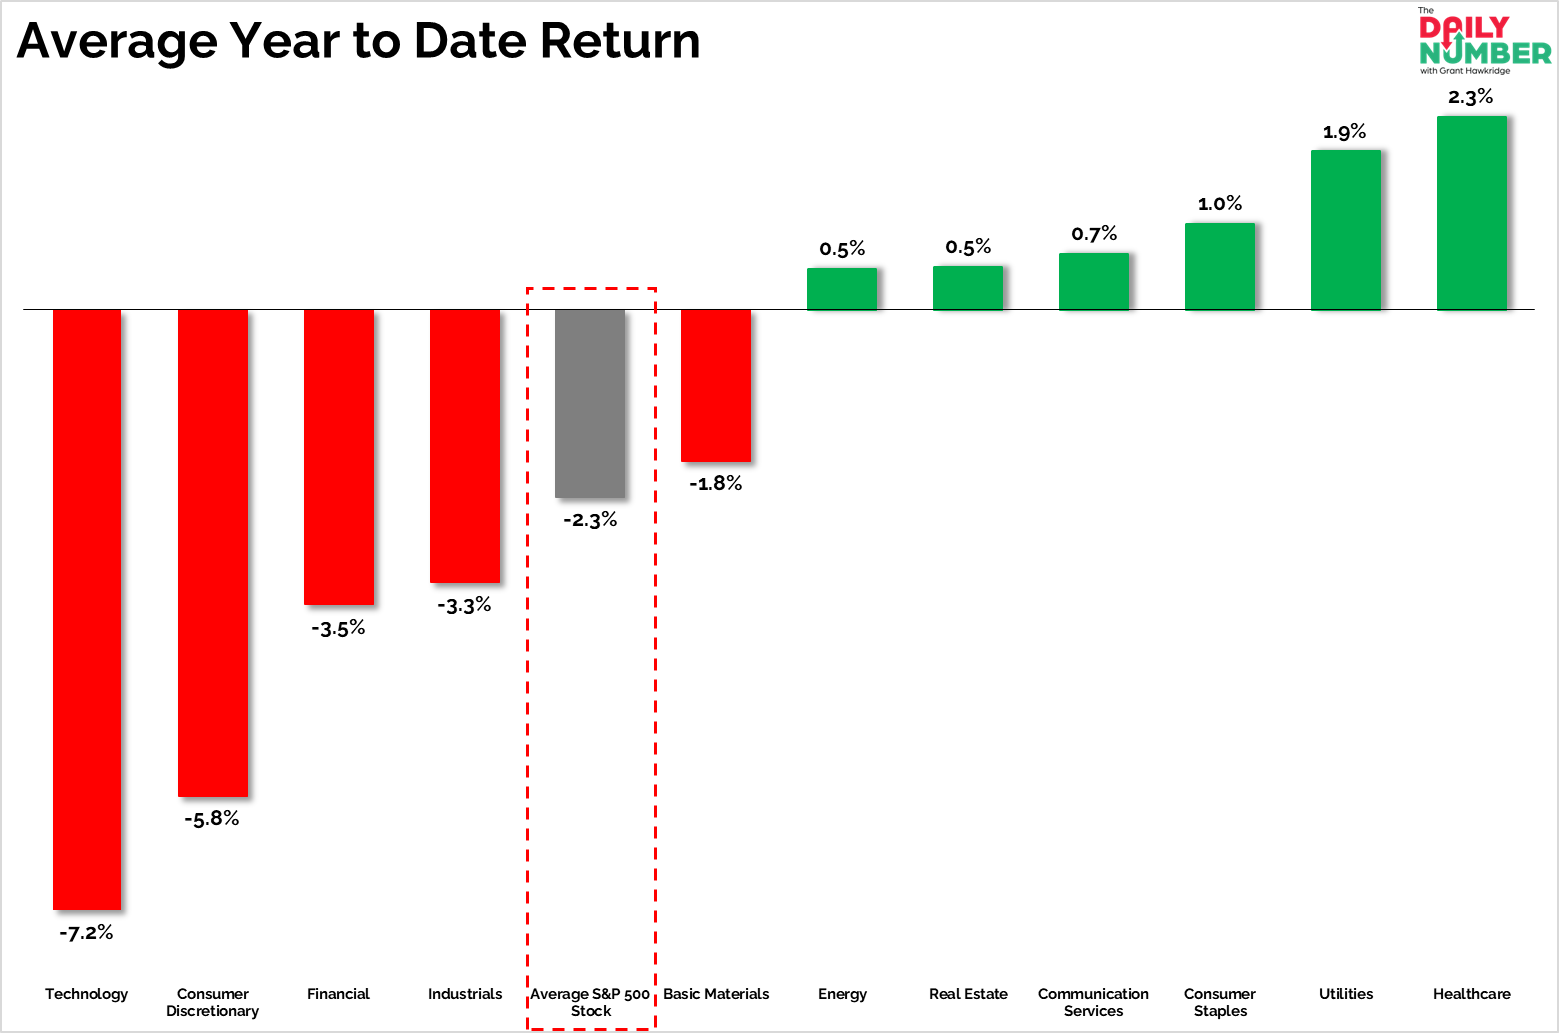
The average stock in the S&P 500 has dropped by -2.3% year-to-date.
Here’s the chart:
Let's break down what the chart shows:
The gray bar illustrates the average stock in the S&P 500 year-to-date return.
The greenandredbars represent the average year-to-date stock returns by sector for the S&P 500.
The Takeaway: In just 14 trading days, the S&P 500 has declined by 9.31% from its all-time highs and is now down 5.26% year-to-date. Along with this correction, the average stock in the S&P 500 is currently showing a negative year-to-date return - which is down -2.3%.
Given the recent increase in market volatility, there are still pockets of strength, with 217 stocks in the S&P 500 outperforming the index with a positive return year-to-date.
However, most of these outperforming stocks come from sectors typically categorized as defensive. These defensive sectors are where money rotates into when stocks are under pressure. If this leadership continues in the defensive sectors, it indicates a market environment where stocks may face greater challenges than we experienced throughout 2023 and 2024.
Do you have a trading plan in place to manage a messy market environment?
Grant Hawkridge | Chief Aussie Operator, All Star Charts
ICYMI: Retail earnings are rolling in, and a clear trend is emerging. What does it mean for the market? Jeff Macke breaks it all down — Read his latest take here.
If you find my content valuable, I would greatly appreciate it if you could share it with your friends, family, and colleagues. Your help in spreading the word is invaluable in supporting our work. Thank you to all of you who share!